How to Know if Your Business Is Profitable

Figuring out if your business is profitable doesn’t have to be complicated. It’s all about understanding your numbers and knowing where to look. Profitability is the heartbeat of any business — it shows if you’re on the right track or need to make some changes.
In this guide, we’ll walk you through how to measure profitability step by step and break down complicated metrics using simple explanations and practical tips. Whether you’re trying to figure out how much your business makes or just curious about what makes a business successful, we’ve got you covered. Let’s dive in and make this process as straightforward as possible!
What is Business Profitability?
Business profitability refers to the financial gain achieved when a company’s total revenues exceed its total expenses.It indicates the efficiency with which a business is managing its operations and resources to generate profits.
Profitability is essential for sustaining operations, funding expansions, and providing returns to stakeholders. It’s measured using various metrics, such as net profit margin, return on assets, and return on equity, which helps assess the company’s financial health and operational success over time. Essentially, profitability is a key indicator of a company’s overall performance and long-term viability.
The Importance of Knowing if Your Company Is Profitable
Understanding your company’s profitability isn’t just about seeing if you’re making money — it’s about making smarter decisions for the future. When you know how to measure profitability, you can identify what’s working, what isn’t, and where to focus your efforts. For example, profitability helps you decide when to expand, hire new staff, or invest in new tools.
On the flip side, not knowing could leave you flying blind and struggling to figure out how much your business makes — or even if you’re covering your expenses. Did you know that 82% of businesses fail due to cash flow issues? Measuring profitability gives you clarity about how to avoid becoming part of that statistic. Plus, it’s a great way to attract investors or secure funding since lenders want a healthy bottom line when seeing a business plan.
How to Measure Business Profitability: Step-By-Step
Measuring business profitability is easier than you think. By breaking it down into clear steps—reviewing financial statements, calculating key metrics, and assessing cash flow—you’ll gain a full picture of your company’s financial health and performance. We’ve made it simple for you and provided plenty of examples to break it down.
1. Start with Financial Statements
Diving into your financial statements is the first step to determining whether your business is profitable. These documents hold the key to understanding where your money is coming from and where it’s going. The three main statements to review are: The profit and loss statement, the balance sheet, and the cash flow statement.
Profit and Loss Statement (P&L)
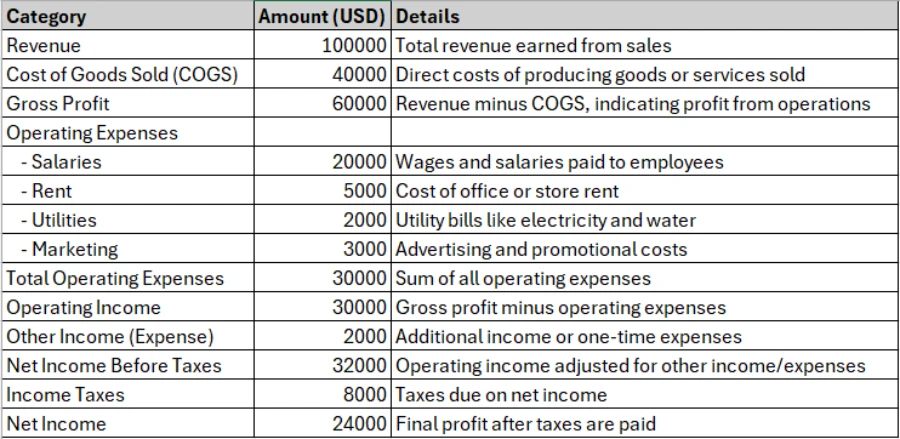
P&L shows your revenue, expenses, and whether you’re making a profit or taking a loss. Here’s how to interpret the information, along with a example statement below:
- Revenue is the total income earned from your business activities, such as product sales or services. In the table below, it’s $100,000, representing all the money brought in before deducting any costs.
- Cost of goods sold (COGS): The direct costs of producing your goods or services. For instance, if you sell products, this includes materials and production costs. In the table, $40,000 is spent on COGS.
- Gross profit: This is your revenue minus COGS. It tells you how much money is left to cover other expenses after production costs. In the example, gross profit is $60,000, showing a 60% gross profit margin.
- Operating expenses: These are day-to-day expenses required to run your business, like salaries, rent, utilities, and marketing. In the table:
- Salaries: $20,000
- Rent: $5,000
- Utilities: $2,000
- Marketing: $3,000 Total operating expenses amount to $30,000.
- Operating income: Gross profit minus operating expenses. This is what’s left after covering operational costs. The table shows $30,000 in operating income.
- Other income (expense): Includes non-operational income or costs, such as interest or one-time gains/losses. Here, the business gains an additional $2,000.
- Net income before taxes: Operating income adjusted for other income or expenses. In this case, it’s $32,000.
- Income taxes: Taxes owed based on the net income. The example deducts $8,000.
- Net income: The final profit after taxes. This is the “bottom line” and shows whether the business is profitable. In the table, the net income is $24,000.
Balance Sheet
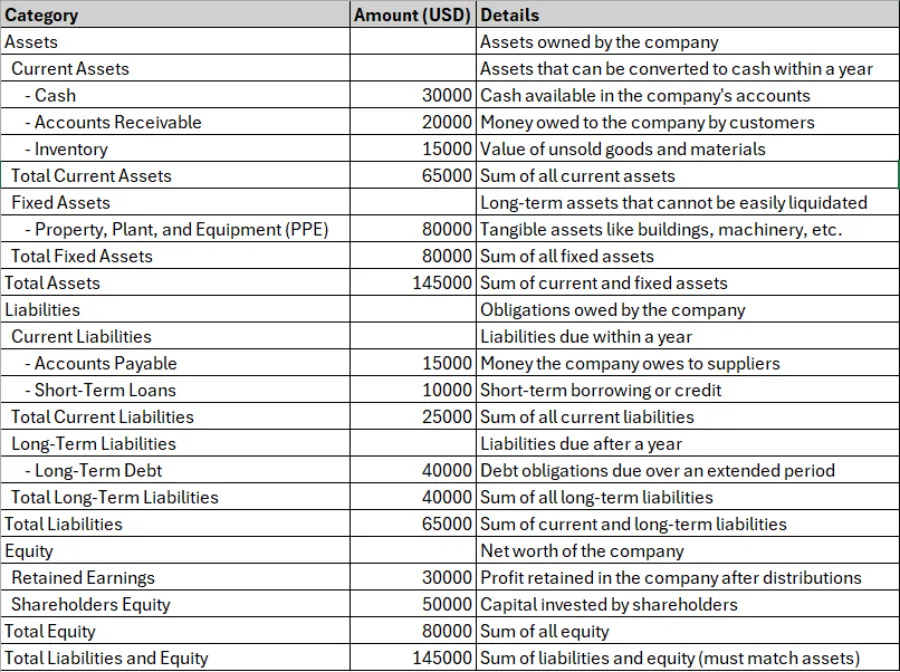
The balance sheet provides a snapshot of your business’s financial health at a specific time. It shows what you own (assets), what you owe (liabilities), and the remaining value (equity). Here’s a break down on the terms you’ll need to know and what they mean:
Assets
- Current assets: These are assets that can be converted into cash within a year.
- Cash: The money your business has readily available. In the example sheet, this is $30,000.
- Accounts receivable: Money owed to your business by customers. Here, it’s $20,000.
- Inventory: The value of unsold products or raw materials. The table lists $15,000.
- Total current assets: The sum of all current assets, which is $65,000.
- Fixed assets: Long-term assets that are not easily converted to cash.
- Property, Plant, and Equipment (PPE): Tangible assets like buildings, machinery, or equipment. In this case, PPE is valued at $80,000.
- Total fixed assets: This equals $80,000.
- Total assets: The total of current and fixed assets, which comes to $145,000. This represents everything the business owns.
Liabilities
- Current liabilities: Obligations due within one year.
- Accounts payable: Amounts your business owes to suppliers, listed as $15,000.
- Short-term loans: Loans due within a year, totaling $10,000.
- Total current liabilities: The sum of current liabilities is $25,000.
- Long-term liabilities: Debts or obligations due after one year.
- Long-term debt: Loans or financing that extend beyond a year, shown as $40,000.
- Total long-term liabilities: This equals $40,000.
- Total liabilities: The total of current and long-term liabilities is $65,000.
Equity
- Retained earnings: Profits reinvested in the business rather than distributed to shareholders. Here, it’s $30,000.
- Shareholders’ equity: Investments made by the business’s owners or shareholders, listed as $50,000.
- Total Equity: The total value of equity is $80,000.
Total Liabilities and Equity
This must equal the Total assets, which is $145,000 in this example. The balance ensures that what the business owns is accounted for by what it owes and what is invested.
Cash Flow Statement
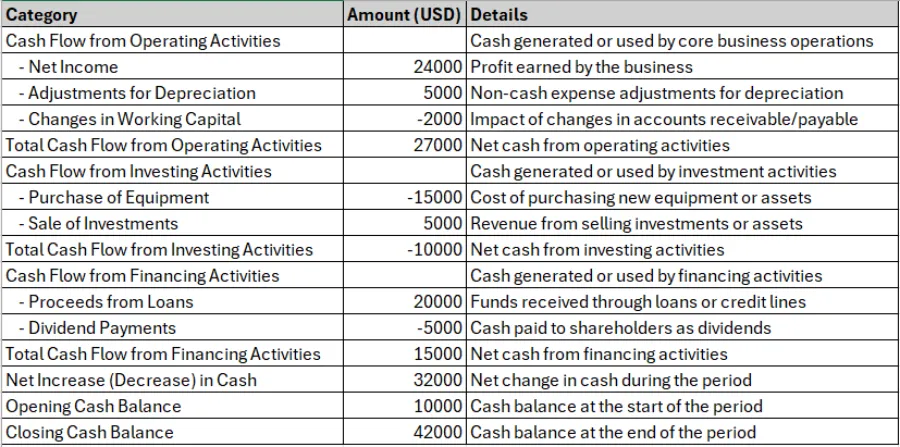
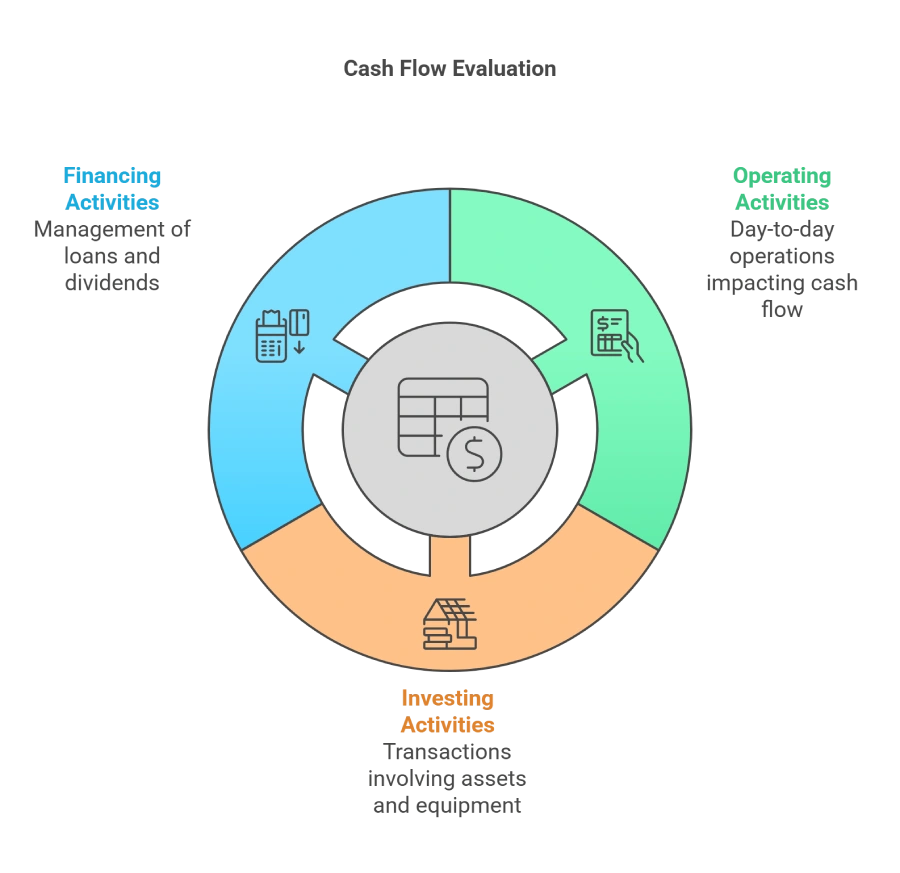
The cash flow statement tracks the movement of money in and out of your business over a specific period, focusing on operations, investments, and financing activities. It shows whether your company has enough cash to sustain operations and fund growth.
Cash Flow from Operating Activities
This section covers cash generated or used by your core business operations:
- Net income: The profit earned during the period is the starting point for cash flow. Here, it’s $24,000.
- Adjustments for depreciation: Non-cash expenses like depreciation are added to reflect their impact on cash flow. In this case, $5,000.
- Changes in working capital: Adjustments due to changes in current assets and liabilities. For instance, an increase in accounts receivable reduces cash, while an increase in accounts payable increases cash. The example shows a decrease of $2,000.
- Total cash flow from operating activities: The net result of the above items is $27,000. This reflects cash generated by day-to-day operations.
Cash Flow from Investing Activities
This section tracks cash spent on or earned from long-term investments:
- Purchase of equipment: Cash used to buy equipment is listed as $15,000.
- Sale of investments: Cash earned from selling investments or assets, shown as $5,000.
- Total cash flow from investing activities: The net cash flow from investments is – $10,000, indicating a net cash outflow.
Cash Flow from Financing Activities
This section deals with cash raised or returned to investors and creditors:
- Proceeds from loans: Cash received from new loans, listed as $20,000.
- Dividend payments: Cash paid out to shareholders as dividends, shown as – $5,000.
- Total cash flow from financing activities: The net result is $15,000, reflecting cash inflows from financing activities.
Net Increase (Decrease) in Cash
This is the total cash flow from all three sections combined:
- Net increase in cash: $27,000 (Operating) – $10,000 (Investing) + $15,000 (Financing) = $32,000.
Opening and Closing Cash Balances
- Opening cash balance: The cash your business had at the start of the period, listed as $10,000.
- Closing cash balance: The cash at the end of the period, which is $42,000 in the example.
These are the foundations for measuring profitability.
2. Key Profitability Metrics
Once you’ve reviewed your financial statements, it’s time to focus on the numbers that matter. Key profitability metrics give you a clear picture of how your business is performing. Here are a few important ones:
Gross Profit Margin
- What it measures: This metric shows the percentage of revenue that remains after covering the cost of goods sold (COGS). It reflects how efficiently you produce or deliver your products and services.
- Formula: (Revenue – COGS) ÷ Revenue
- Example: If your revenue is $100,000 and your COGS is $40,000, your gross profit margin is 60%.
- Why it matters: A high gross profit margin indicates you’re keeping more revenue after production costs, leaving room to cover other expenses like rent and salaries.
Net Profit Margin
- What it measures: This is your business’s bottom line—it shows how much profit remains after all expenses, including operating costs, taxes, and interest, are deducted.
- Formula: (Net Income ÷ Revenue)
- Example: If your net income is $24,000 and your revenue is $100,000, your net profit margin is 24%.
- Why it matters: Net profit margin is the ultimate measure of profitability, giving you a clear picture of how much money you’re actually taking home for every dollar earned.
Operating Margin
- What it measures: This metric focuses on your operational efficiency, showing how much revenue is left after covering operating expenses like salaries and marketing.
- Formula: (Operating Income ÷ Revenue)
- Example: If your operating income is $30,000 and your revenue is $100,000, your operating margin is 30%.
- Why it matters: A healthy operating margin indicates that your core operations are running efficiently and generating enough revenue to cover operating expenses.
How to Use These Metrics
- Track trends: Compare these metrics over time to identify patterns in your business performance.
- Benchmark: Compare your margins to industry averages to see how your business stacks up against competitors.
- Set goals: Use these metrics to establish realistic profitability targets and guide strategic decisions.
Regularly monitoring these metrics allows you to gain valuable insights into your business’s financial health and make informed decisions to optimize profitability.

Tracking these metrics regularly is a simple but powerful measure of profitability. You should also understand the difference between gross profit and margin earnings.
Recommended Accounting Software Tools
Intuit Quickbooks – Simplifies bookkeeping for small businesses
Zoho Books – Affordable, user-friendly accounting for growing teams
Square – Seamless payment integration with easy financial tracking
3. Evaluating Cash Flow for Profitability
Cash flow is the lifeblood of any business and plays a huge role in understanding profitability. A negative cash flow can spell trouble even if your company appears profitable on paper. Start by reviewing your cash flow statement to track where money is coming from and going. Focus on three main sections:
- Operating activities: Day-to-day operations like sales and expenses.
- Investing activities: Buying or selling equipment and assets.
- Financing activities: Loans, credit lines, and dividend payments.
A steady, positive cash flow means your business can cover its expenses and still grow, a vital measure of healthy profitability. Aim for an operating cash flow margin of 10-15% of revenue or higher as a benchmark for success, depending on your industry.
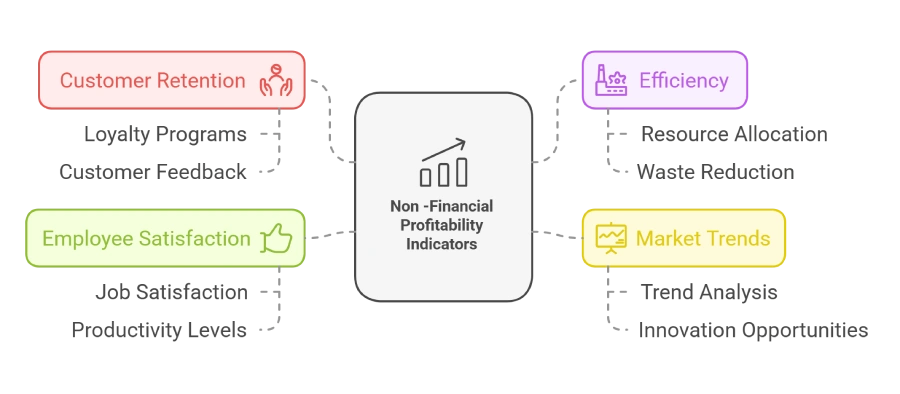
4. Other Factors That Indicate Profitability
Profitability is far from being only numbers and percentages; it’s also about how well your business runs. Here are some other factors that can help shed some insights:
- Customer retention: Loyal customers are a sign of a stable business. If your customer base keeps growing, your revenue might follow.
- Efficiency: Are you maximizing resources? High productivity with minimal waste shows strong profitability potential.
- Market trends: Staying ahead of industry trends can create new revenue opportunities while keeping your business competitive. For these purposes, I recommend conducting a SWOT analysis and in-depth market research to understand better where your business stands relative to your competitors.
- Employee satisfaction: Happy employees tend to be more productive, which can lead to higher profits in the long run.
Take the time to evaluate these areas alongside financial metrics. While they may not directly show how much a business makes, they’re strong indicators of its long-term success.
Warning Signs and Red Flags
Even a business that looks profitable might face challenges. Here are some warning signs to watch for:
- Declining revenue: If your income consistently drops, it may indicate trouble ahead.
- High operational costs: Excessive spending on salaries, utilities, or rent can eat into your profits.
- Rising debt levels: Increasing liabilities without a matching rise in revenue could signal cash flow issues.
- Inventory problems: Overstocking or slow-moving inventory ties up valuable resources.
- Inconsistent cash flows: Erratic cash flow can hinder the ability to cover expenses and invest in growth opportunities. Consistency in cash inflow is crucial for stability.
- Low customer retention rates: A decline in customer loyalty or repeat business can be a precursor to revenue loss, indicating dissatisfaction or better alternatives in the market.
- Decreasing profit margins: A gradual thinning of margins, despite stable revenue, could point to rising costs or pricing issues that may need strategic adjustments.
- Weak financial ratios: Ratios such as the current ratio, quick ratio, and debt-to-equity ratio provide insights into financial health. Deteriorating ratios can be a sign of underlying financial distress.
- High employee turnover: Frequent turnover can lead to increased training costs and decreased productivity, ultimately affecting profitability.
These red flags may not always mean your business is unprofitable, but they’re worth addressing early to stay on track.
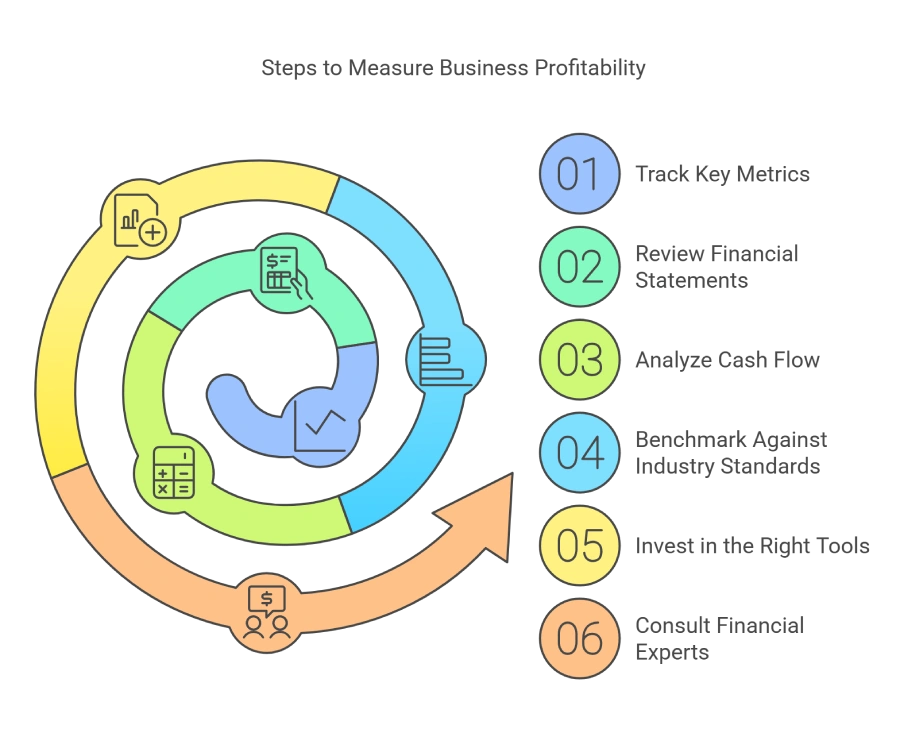
Practical Steps for Investors or Business Owners
If you’re a business owner or investor, understanding profitability is crucial for making informed decisions. It’s always recommended that some profit maximization strategies be developed.
Here’s how to take actionable steps:
Track Key Metrics Regularly
Monitoring profitability metrics like gross profit margin, net profit margin, and operating margin is essential for staying on top of your financial health. Trends in these metrics can reveal whether your pricing strategy or cost management needs adjustment.
- Tip: Set up automated reports in accounting software to get weekly or monthly updates on key metrics. This saves time and ensures you never miss critical changes in your business performance.
Review Financial Statements
Regularly review your profit and loss statement, balance sheet, and cash flow statement to identify trends, potential issues, or areas for improvement. Pay special attention to your operating expenses and inventory costs—small inefficiencies here can erode your profits.
- Tip: Schedule a monthly or quarterly “financial checkup” to review these documents alongside your accountant or financial advisor.
Analyze Cash Flow
A steady, positive cash flow ensures your business can cover expenses and reinvest for growth. Aim for an operating cash flow margin of 10-15% of revenue to ensure healthy liquidity.
- Tip: Use tools like cash flow forecasting to predict future financial needs and address gaps before they occur.
Benchmark Against Industry Standards
Compare your financial metrics with industry averages to identify where your business excels or lags. Be mindful of regional differences or market conditions that might skew benchmarks, and adjust your comparisons accordingly.
- Tip: Use online industry reports or databases to find up-to-date benchmarking data specific to your sector.
Invest in the Right Tools
Using the right tools can improve efficiency and streamline your financial management. Consider software for bookkeeping, payroll, or inventory tracking tailored to small businesses. Many tools offer free trials, so test a few to see which one aligns best with your business needs.
- Tip: Look for tools that integrate with one another (e.g., accounting software that syncs with inventory systems) to reduce manual data entry.
Consult Financial Experts
A financial advisor or accountant can provide valuable guidance on improving profitability and addressing potential red flags. Experts can also help with tax planning, ensuring you maximize deductions and reduce liabilities.
- Tip: Meet with an accountant or financial advisor at least twice a year to review your financial performance and discuss growth strategies.
By following these steps, you can measure profitability more effectively and make decisions that promote growth and sustainability. Whether you’re figuring out how to measure profitability or how to find out how much a business makes, these strategies will keep you on the right track.
Final Thoughts
Knowing if your business is profitable is more than just crunching numbers — it’s about understanding what drives your success and identifying areas for improvement. You’ll have a clear picture of your company’s health by regularly tracking key metrics, analyzing financial statements, and paying attention to factors like cash flow and operational efficiency.
With accounting tools and strategies designed for small businesses, you can stay on top of your finances without feeling overwhelmed. Whether you’re figuring out how to measure profitability or learning what makes a business successful, small changes can lead to big results.
Take the time to evaluate your business, address any warning signs, and make data-driven decisions. With the right approach, you can build a sustainable, profitable business that continues to grow.
FAQ
Q: How do you determine profitable business?
A: Review financial statements, calculate key metrics like net profit margin, and assess cash flow and revenue growth.
Q: What is the best indicator of a company’s profitability?
A: Net profit margin is the best indicator, showing the percentage of revenue left after all expenses.
Q: How do you know if a company will be profitable?
A: Consistent revenue, controlled costs, positive cash flow, and strong market positioning are good indicators.
Q: What is a good profit margin for a small business?
A: Ideally, 10-20% net profit margin is healthy and what you should aim for most small businesses.
Q: Does margin mean profit?
A: No. Margin is a percentage, while profit is the actual dollar amount earned.