How to Calculate Your Break-Even Point and Transform Your Business

The break-even point (BEP) is a fundamental financial metric in business. It represents the sales volume at which total revenues equal total costs, meaning a company neither gains profit nor incurs a loss. Mastering break-even analysis and understanding how to calculate the BEP helps businesses set effective sales targets, manage costs, and drive strategic decisions.
Why the Break-Even Point Matters for Businesses
The break-even point for a business is more than just a financial milestone—it’s a guidepost for sustainable operations and profitability. Knowing the break-even point helps businesses:
- Set Sales Targets: Establishes the minimum sales volume required to avoid losses.
- Boost Profitability: Every unit sold beyond the break-even point contributes directly to profit.
- Inform Strategy: Assists managers in making data-driven decisions on pricing, cost structure, and investment in growth.
Core Components of Break-Even Analysis
To understand the break-even point and use a break-even calculator effectively, it’s essential to distinguish between two key cost categories:
- Fixed Costs: These are costs that remain constant regardless of production volume, such as rent, insurance, and salaries.
- Variable Costs: These costs change with production levels, including materials, labor, and shipping.
Together, these costs form the foundation of the break-even point formula, which is essential for setting informed business goals.
Break-Even Point Formula and Step-by-Step Calculation
The break-even point formula calculates how many units a business must sell to cover fixed and variable costs.
The Break-Even Point Formula is:
Step-by-Step Calculation
- Identify Fixed Costs: Sum up all fixed monthly costs, like rent, salaries, and utilities.
- Determine Selling Price per Unit: Set the price at which each unit will be sold.
- Calculate Variable Cost per Unit: Add up all costs that vary per unit, such as raw materials and direct labor.
- Apply the Break-Even Formula: Subtract the variable cost per unit from the selling price per unit to get the contribution margin. Divide fixed costs by this margin to find the break-even point.
Example Calculation:
Suppose a business has fixed costs of $20,000, sells each unit for $50, and has a variable cost per unit of $30:
Break-Even Point (Units)= 20,000 / (50−30) = 20,000/20 = 1,000 units
This calculation shows that the business must sell 1,000 units to reach its break-even point.
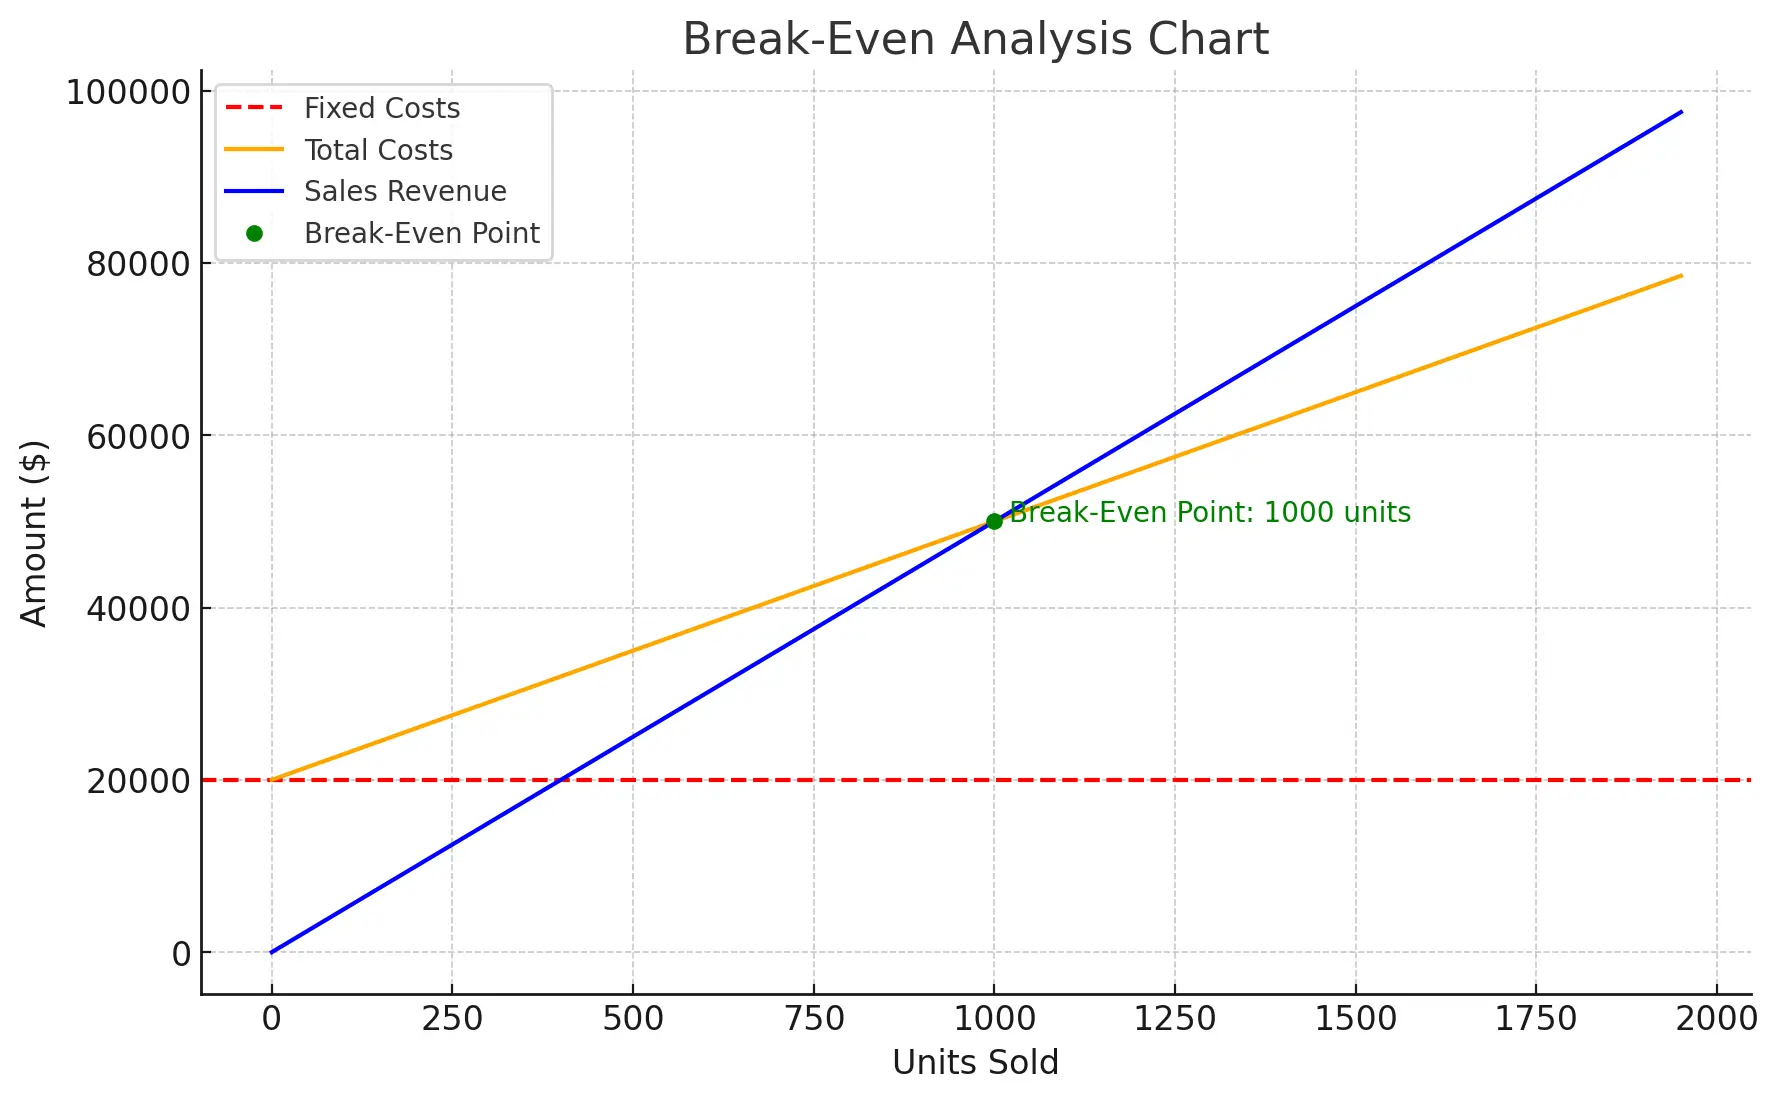
Here’s a break-even analysis chart that visually represents the relationship between units sold, costs, and revenue:
- Fixed Costs Line (red, dashed): This line remains constant across all units sold.
- Total Costs Line (orange): Combines fixed and variable costs, increasing as more units are sold.
- Sales Revenue Line (blue): Shows revenue growth with each unit sold.
The break-even point is marked in green, showing where total costs and sales revenue intersect, indicating the minimum units needed to cover costs.
Real-World Examples of Break-Even Analysis Across Industries
Applying the break-even calculator can be insightful across various industries:
- Retail: A clothing store with $40,000 monthly fixed costs, an average selling price of $80, and variable costs of $30 per item needs to sell 800 items monthly to cover costs.
- SaaS (Software as a Service): A SaaS company with annual fixed costs of $120,000, a monthly subscription fee of $100, and variable costs of $25 per user needs 134 monthly subscribers to break even.
- Food Service: A food truck with $7,000 monthly fixed costs, a variable cost per meal of $4, and a selling price of $10 per meal needs to sell 1,167 meals monthly to cover costs.
Related Articles


Practical Uses of Break-Even Analysis in Business
- Financial Forecasting: Companies can set realistic revenue targets to achieve profitability by knowing how to calculate the break-even point.
- Risk Assessment: Provides insight into the minimum level of sales needed to prevent losses, allowing businesses to plan accordingly.
- Pricing Strategy: Understanding the break-even point guides pricing adjustments, ensuring all costs are covered while remaining competitive.
Limitations of the Break-Even Point Formula
While powerful, the break-even point formula has some limitations:
- Static Assumptions: Assumes constant costs and prices, which may not hold in changing markets.
- Excludes External Market Factors: Doesn’t consider competitor pricing, economic shifts, or changes in demand.
- Simplifies Costs: Classifies all costs as fixed or variable, although some may have mixed characteristics.
Regular updates to break-even analysis can help address these limitations, keeping projections aligned with current conditions.
Break-Even Point Chart: Visual Guide to Profitability
Visualizing break-even analysis through a chart is an effective way to understand the dynamics between costs, revenues, and profits. A break-even chart clearly and intuitively highlights the relationships and interactions between different financial components. Let’s dive into how to create and interpret a break-even chart, which is pivotal for businesses aiming to visualize their path to profitability.
A break-even chart illustrates where costs equal revenue, helping visualize how much a company needs to sell to cover expenses. Here’s what each line represents:
Components of a Break-Even Chart
-
Fixed Cost Line:
- Definition: The fixed cost line represents costs that do not change regardless of the level of production or sales volume. These include expenses such as rent, salaries, and insurance.
- Representation: On a break-even chart, the fixed cost line is horizontal, starting from the y-axis at the fixed cost value, illustrating its consistency over various output levels.
-
Total Cost Line:
- Definition: Total costs are the sum of fixed and variable costs incurred by a business. Variable costs change with the level of production or sales, such as raw materials and direct labor costs.
- Representation: The total cost line begins at the fixed cost level on the y-axis and slopes upward, reflecting the increase in total costs as sales volume increases. The slope of this line depends on the variable cost per unit.
-
Sales Revenue Line:
- Definition: This line represents the total revenue generated from selling products or services. It depends on the sales price per unit and the number of units sold.
- Representation: Starting from the origin (0,0), the sales revenue line slopes upward. The line’s steepness is determined by the sales price per unit, with a steeper line indicating a higher price.
Creating a Break-Even Chart
To construct a break-even chart, follow these steps:
-
Plotting the Fixed Cost Line: Draw a horizontal line from the fixed cost value on the y-axis. This line stays constant across all levels of production.
-
Drawing the Total Cost Line: Begin this line at the point where the fixed cost line meets the y-axis. The line should slope upwards, with its angle determined by adding the variable cost per unit to the fixed costs. For each unit sold, the total cost increases by the variable cost per unit.
-
Adding the Sales Revenue Line: Start this line at the origin (0,0), as no sales mean no revenue. Draw the upward line with a slope representing the sales price per unit. This line indicates how revenue grows as more units are sold.
The break-even point is where the sales revenue line intersects with the total cost line. To the right of this point, the revenue line stays above total costs, signifying profit; to the left, it means a loss.
Sensitivity Analysis in Break-Even Calculations
A break-even calculator can be paired with sensitivity analysis to prepare for market fluctuations. This involves adjusting variables like fixed costs, variable costs, or selling prices to see how changes affect the break-even point. Sensitivity analysis is especially valuable in dynamic markets, where cost or demand shifts are common.
Advanced Uses of Break-Even Analysis
Once you understand the basics, there are more advanced ways to use break-even analysis:
- Multi-Product Break-Even: For companies with multiple products, break-even can be calculated for each one. Alternatively, find a weighted average based on each product’s contribution margin.
- Adjusting for Taxes: Adding taxes to the cost structure provides a more accurate view, especially for high-margin businesses.
- Seasonal Forecasting: If demand fluctuates seasonally, break-even analysis can be recalculated based on fixed or variable costs to give more realistic targets.
Using these advanced methods, you can tailor break-even analysis to fit the specific needs of your business.
Common Mistakes in Break-Even Analysis
Even though break-even analysis is straightforward, some common mistakes can lead to inaccurate results. Here are a few pitfalls to avoid:
- Misclassifying Costs: Make sure to differentiate between fixed and variable costs. For example, if certain labor costs vary with production, they should be classified as variable.
- Ignoring Seasonal Fluctuations: For businesses with seasonal demand, calculate break-even for peak and off-peak times separately to get an accurate picture.
- Overlooking Hidden Costs: Costs like maintenance, minor repairs, or marketing may be overlooked but should be included for a precise break-even point.
Applications in Pricing and Cost Management
Using break-even analysis to refine pricing and manage costs gives businesses a competitive edge:
- Setting Competitive Prices: By knowing the break-even point, companies can set prices that ensure costs are covered while remaining market-competitive.
- Cost Control: Identifying and managing high-impact costs helps achieve the break-even point and optimizes profitability.
- Budgeting and Financial Planning: Businesses can use break-even analysis for robust budget planning, ensuring all key cost components are considered.
Final Thoughts on the Break-Even Point
The break-even point is a powerful financial metric that serves as a roadmap to profitability. By calculating it, businesses gain critical insights into the minimum sales needed to cover costs and avoid losses. This metric is foundational for setting realistic sales goals, making informed pricing decisions, and managing fixed and variable expenses effectively.
Using break-even analysis, companies can identify cost-saving opportunities and align their pricing strategies to remain competitive while ensuring profitability. When combined with tools like sensitivity analysis, the break-even point becomes even more versatile, allowing businesses to adapt to market changes and plan for various financial scenarios.
Ultimately, mastering the break-even point empowers businesses to make data-driven decisions, enhancing their ability to navigate challenges, optimize resources, and achieve sustainable growth. By consistently applying break-even analysis, companies can build a resilient financial strategy that supports long-term success.