HR Metrics for Small Businesses: What to Measure & Why It Matters
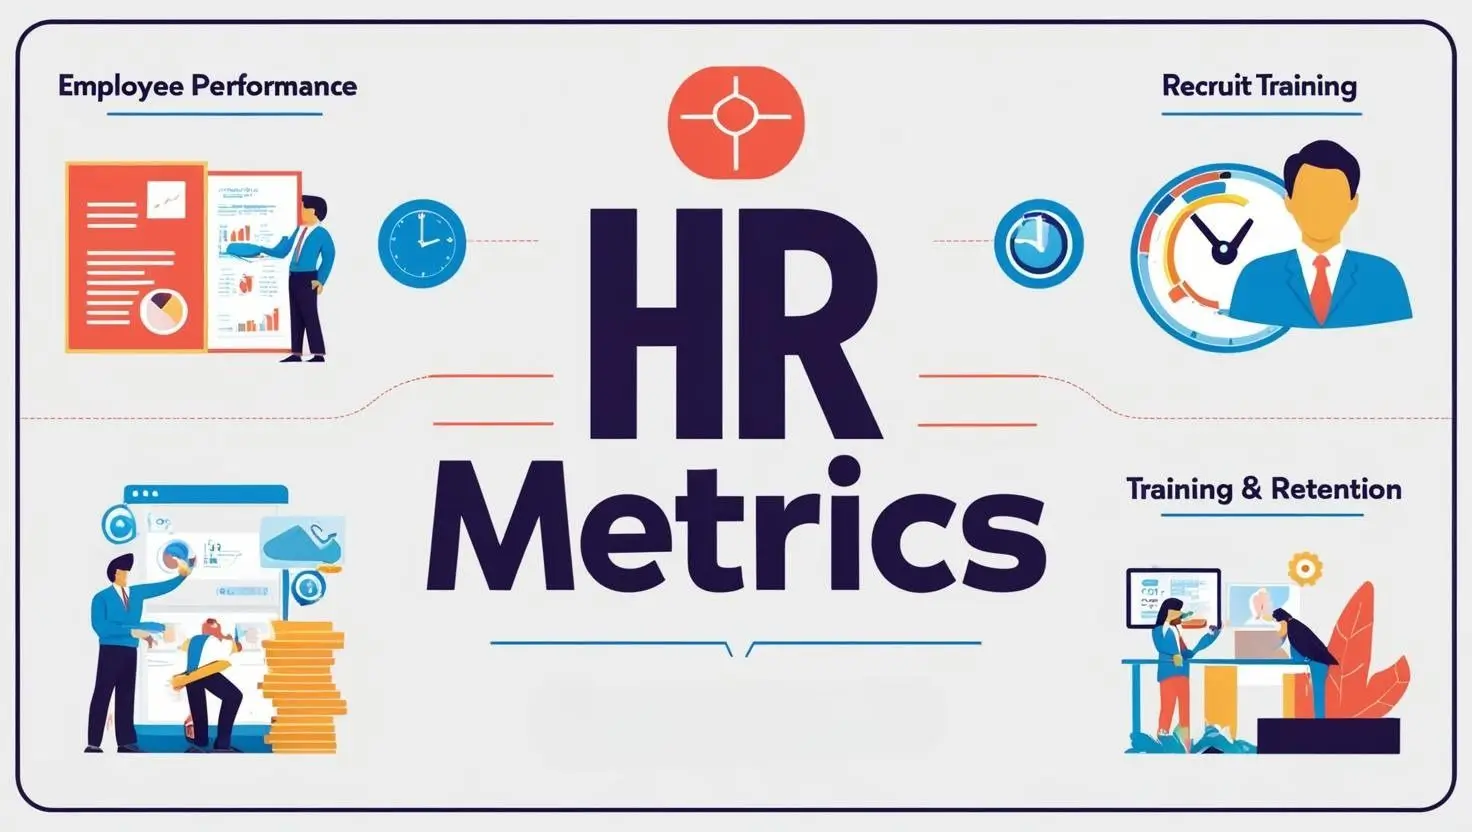
For small and mid-sized businesses (SMBs), data-driven HR decisions can mean the difference between stagnation and scalable growth. That’s where HR metrics come in. These measurable indicators help SMBs track employee performance, manage costs, boost retention, and improve the overall health of their workforce.
Whether you’re using a basic HR tool or a full-service platform, understanding and monitoring the right HR metrics and analytics will empower you to:
-
Make smarter hiring decisions
-
Identify potential problems before they escalate
-
Streamline workforce planning and operations
-
Align your HR strategy with business goals
What Are HR Metrics?
HR metrics, also called human resource metrics, are data points that quantify various aspects of your workforce and human resources processes. These include hiring, retention, performance, engagement, and workforce cost measurements. They are often tracked using HR software tools or spreadsheets and are the foundation for analyzing how effectively your HR strategies support business goals.
Examples include cost per hire, turnover rate, absenteeism, time to hire, and employee satisfaction. These metrics give SMBs insight into their teams’ efficiency, productivity, and stability.
Why Are HR Metrics Important for SMBs?
Resources are often limited for small businesses, and hiring or retaining the wrong people can have a massive impact. HR metrics and analytics help SMBs:
-
Make data-informed decisions: Instead of guessing, you can use metrics to justify hires, policy changes, and training investments.
-
Optimize resources: Know where your HR budget is going and what’s generating the most ROI.
-
Reduce turnover and absenteeism: Identify issues before they affect team morale and productivity.
-
Benchmark performance: Track improvements over time or compare departments.
-
Support growth: Scale confidently by knowing which areas need reinforcement.
Important HR Metrics Every Small Business Should Track (Detailed Overview)
Below is a detailed list of HR metrics every SMB should consider. These include foundational KPIs like time to hire, employee turnover rate, and cost per hire, as well as more advanced insights like employee growth rate, revenue per employee, and quality of hire. These are the HR metrics to track to improve operational efficiency and long-term growth.
Key HR Metrics Every Small Business Should Track (Detailed Overview)
1. Cost per Hire
Definition: The average amount of money spent by a business to hire one new employee.
Formula: Cost per hire = (Internal Recruiting Costs + External Recruiting Costs) ÷ Total Number of Hires
What It Includes:
-
Internal costs: HR team salaries, employee referral bonuses, onboarding software costs, in-house recruiter time, internal job board platform subscriptions
-
External costs: Job advertising, recruitment agency fees, background checks, signing bonuses, candidate travel reimbursements, marketing
Why It Matters: For SMBs, hiring budgets are typically limited. Measuring cost per hire helps small businesses optimize their recruiting efforts, allocate budgets efficiently, and reduce the time and resources spent per hire.
Impact on Your Business:
-
Reveals the financial burden of each new hire
-
Helps evaluate which recruitment sources (e.g. job boards vs. agencies) offer the best ROI
-
Supports scaling by showing whether current hiring strategies are financially sustainable
-
Helps HR and finance teams justify changes in recruitment budgets** Monitoring this helps optimize your recruitment strategy and reduce spending without sacrificing hire quality.
2. Time to Hire
Definition: Time to hire is the number of calendar days it takes to move a candidate through the recruitment process—from job posting to offer acceptance.
Formula: Time to Hire = Date of Offer Acceptance – Date Job Posted
What It Includes:
-
Resume screening
-
Interviews (phone, video, or in-person)
-
Hiring manager evaluations
-
Background checks
-
Offer approvals
Why It Matters: A lengthy hiring process can lead to lost candidates, higher costs, and longer periods of lost productivity. Keeping this metric optimized is crucial for SMBs, as one missing hire may stall business operations.
Impact on Your Business:
-
Shorter time to hire can help secure top candidates before competitors
-
Reduces time spent by staff on repetitive recruiting tasks
-
Accelerates project timelines by filling roles faster
-
Provides insight into recruitment bottlenecks and inefficiencies** Speeding up the hiring process allows you to fill crucial roles faster and minimize disruptions.
3. Employee Turnover Rate
Definition: The employee turnover rate calculates the percentage of workers who leave the business during a specified time period.
Formula: Turnover Rate = (Number of Departures ÷ Average Number of Employees) x 100
What It Includes:
-
Both voluntary (resignations) and involuntary (terminations) separations
Why It Matters: A high turnover rate can lead to increased recruiting and onboarding costs, lower team morale, and reduced productivity. For SMBs with lean teams, each departure can have a disproportionate impact.
Impact on Your Business:
-
Helps uncover underlying issues such as poor management or lack of growth opportunities
-
Identifies departments or roles with retention challenges
-
Enables budgeting for hiring and onboarding
-
Assists in evaluating success of employee engagement strategies** Reducing turnover lowers recruitment costs and increases team stability.
4. Involuntary Turnover Rate
Definition: This metric shows the percentage of employees whose exit from the organization was not voluntary (e.g., fired or laid off).
Formula: Involuntary Turnover = (Number of Involuntary Separations ÷ Total Number of Employees) x 100
What It Includes:
-
Terminations for performance
-
Layoffs due to downsizing
-
Role eliminations or restructuring
Why It Matters: A high involuntary turnover rate may suggest poor hiring decisions, insufficient training, or a mismatch between employee expectations and job requirements.
Impact on Your Business:
-
Increases legal risk if terminations are not handled properly
-
Reflects on company culture and management effectiveness
-
Offers insight into where onboarding or role clarity might be lacking
-
Guides investments in training or candidate screening improvements** Monitoring this helps improve recruitment, onboarding, and performance management.
5. Retention Rate
Definition: Retention rate indicates the percentage of employees who stay with your company over a specific time frame (usually annually).
Formula: Retention Rate = (Number of Employees Remaining ÷ Number of Employees at Start) x 100
What It Includes:
-
Employees who have completed the full measurement period
Why It Matters: High retention is typically a sign of a healthy work environment, competitive compensation, and strong management. It also results in lower hiring and training costs.
Impact on Your Business:
-
Improves continuity and institutional knowledge
-
Reduces HR and recruiting costs over time
-
Builds employer brand and increases referrals
-
Serves as a benchmark for engagement and culture initiatives** Indicates employee satisfaction, effective leadership, and good cultural fit.
6. Average Tenure
Definition: Average tenure reflects the typical length of time employees remain with your company.
Formula: Average Tenure = Sum of All Employee Tenure ÷ Total Number of Employees
What It Includes:
-
Number of years (or months) each employee has been with the company
-
Can be segmented by department or role
Why It Matters: Longer tenure typically suggests employee satisfaction, strong leadership, and effective career progression. Short tenure may indicate poor onboarding, lack of engagement, or misaligned expectations.
Impact on Your Business:
-
Longer tenures reduce hiring/training costs
-
Provides insight into career development practices
-
Helps predict future hiring needs and leadership gaps
-
Indicates the long-term value delivered by your workforce** Helps benchmark success of your employee experience and onboarding processes.
7. Absenteeism Rate
Definition: The absenteeism rate tracks how often employees miss work without prior notice or a scheduled leave.
Formula: Absenteeism Rate = (Total Unscheduled Absences ÷ Total Available Workdays) x 100
What It Includes:
-
Sick days
-
Personal emergencies
-
Unapproved time off (not vacations or holidays)
Why It Matters: High absenteeism can reduce productivity, lower morale, and place added stress on team members. It may also reflect burnout, disengagement, or health issues within the workforce.
Impact on Your Business:
-
Identifies staffing shortages and unbalanced workloads
-
Signals the need for wellness programs or flexible policies
-
Helps forecast scheduling needs and reduce disruptions
-
Encourages better time-off tracking and planning. Identifies burnout, engagement problems, or work-life balance issues.
8. Overtime Expense
Definition: Overtime expense refers to the total additional wages paid to employees for working beyond standard hours.
Formula: Overtime Expense = Total Overtime Hours x Overtime Pay Rate
What It Includes:
-
Time worked over 40 hours/week (or threshold set by law)
-
Standard pay plus overtime premiums (e.g., 1.5x rate)
Why It Matters: Frequent or rising overtime suggests understaffing, poor planning, or overworked teams. It may also result in compliance issues if not tracked properly.
Impact on Your Business:
-
Helps determine if hiring more staff is more cost-effective than paying overtime
-
Encourages process optimization and workload balancing
-
Can improve work-life balance by limiting excessive workloads
-
Supports budget forecasting for labor costs** Helps identify when to hire, reassign, or automate work.
9. Employee Engagement Score
Definition: This score represents how emotionally committed employees are to the organization and its goals.
How It’s Measured:
-
Surveys measuring job satisfaction, team alignment, and motivation
-
Participation in meetings, feedback sessions, or programs
-
Optional metrics like internal referral rates or feedback submissions
Why It Matters: Engaged employees are more likely to perform well, stay longer, and contribute positively to company culture. Disengaged employees can cost businesses in lost productivity and higher turnover.
Impact on Your Business:
-
Enhances innovation and collaboration
-
Supports internal promotion and retention efforts
-
Reduces absenteeism and improves overall morale
-
Boosts customer satisfaction through better employee output** Engaged teams outperform disengaged ones in customer service, output, and morale.
10. Employee Satisfaction Score
Definition: A survey-based metric that measures how happy and content employees are with their job, role, work environment, and company culture.
How It’s Measured:
-
Employee Net Promoter Score (eNPS)
-
Anonymous surveys about job satisfaction, compensation, career growth, and workplace culture
-
Sentiment analysis from feedback and engagement tools
What It Includes:
-
Questions on management support, communication, workload, work-life balance, recognition, and team dynamics
Why It Matters: High satisfaction is directly tied to retention, productivity, and employee referrals. Unhappy employees are more likely to leave, underperform, or create negative team dynamics.
Impact on Your Business:
-
Improves team cohesion and morale
-
Enhances employer branding and recruiting efforts
-
Supports proactive HR strategies around wellness, benefits, or leadership development** Directly linked to positive culture and employer branding.
11. Performance Metrics
Definition: Key performance indicators (KPIs) that evaluate how effectively employees are fulfilling their job responsibilities and contributing to company goals.
What It Includes:
-
Individual goals met or missed
-
Manager evaluations and peer reviews
-
Productivity benchmarks (output, revenue generated, quality scores)
Why It Matters: Performance metrics offer insights into who your top performers are, which roles may need support, and where training gaps exist.
Impact on Your Business:
-
Informs promotion, compensation, and training decisions
-
Helps identify leadership potential within the team
-
Boosts accountability and supports fair performance reviews** Helps with promotions, raises, and training decisions.
12. Billable Hours per Employee
Definition: The amount of time an employee spends on tasks or projects that generate revenue for the business.
Formula: Billable Hours ÷ Total Working Hours
What It Includes:
-
Time spent working on client deliverables, support, consulting, or other revenue-linked activities
-
Tracked using time-tracking software or manual logs
Why It Matters: Especially relevant for service-based SMBs like agencies, legal firms, or IT consultants. Low billable hours may indicate inefficiency, underutilization, or poor project allocation.
Impact on Your Business:
-
Helps assess employee profitability and pricing accuracy
-
Optimizes staffing, workload planning, and client billing
-
Drives decisions around resource hiring or redistribution. Helps calculate ROI on staffing and adjust resource planning.
13. Cost of Workforce
Definition: The total cost of employing your workforce, including direct and indirect expenses.
Formula: Cost of Workforce = Total Payroll + Benefits + Taxes + Overhead + Other Compensation
What It Includes:
-
Wages and salaries
-
Payroll taxes
-
Insurance and retirement contributions
-
Perks, bonuses, and office overheads (space, tools, training)
Why It Matters: This is one of the largest expenses for any SMB. Understanding this cost is essential for budgeting, profitability forecasting, and cost control.
Impact on Your Business:
-
Provides a realistic view of workforce ROI
-
Informs pricing strategy and capacity planning
-
Helps avoid overspending on underutilized roles** Understanding workforce cost per department helps optimize budgets.
14. Expenses per Employee
Definition: The total operational costs associated with each employee, averaged across your workforce.
Formula: Expenses per Employee = Total Operational Costs ÷ Number of Employees
What It Includes:
-
Software licenses and hardware
-
Office supplies and utilities
-
Training and development programs
-
Travel, meals, and entertainment
-
IT support and communication tools
Why It Matters: This metric gives insight into the indirect cost of employment. High expenses per employee can reflect inefficiencies in tool usage or bloated operations.
Impact on Your Business:
-
Helps identify unnecessary expenses per role or department
-
Enables budgeting per employee based on department needs
-
Encourages optimization of tools and workspace costs
-
Provides benchmarks for scalability and sustainability** Helps reduce waste and improve resource allocation.
15. Turnover Cost
Definition: The total financial loss incurred when an employee leaves your organization.
Formula: Turnover Cost = Cost of Hire + Onboarding Costs + Lost Productivity Estimate
What It Includes:
-
Recruiting and advertising costs
-
Interview time and administrative processing
-
Onboarding and training expenses
-
Lost productivity and knowledge transfer gaps
Why It Matters: High turnover cost often goes unnoticed but significantly affects profit margins. It underscores the need for retention strategies.
Impact on Your Business:
-
Justifies investments in engagement, learning, and recognition programs
-
Encourages better culture-building and onboarding practices
-
Helps forecast true costs of staff attrition for budgeting** Justifies investment in retention and engagement strategies.
16. Employee Growth Rate
Definition: A measure of how quickly your workforce is growing over a specific time frame.
Formula: Employee Growth Rate = ((New Hires – Departures) ÷ Starting Headcount) x 100
What It Includes:
-
Net gain or loss in total employee headcount over a quarter or year
Why It Matters: It helps track business expansion or contraction. Steady growth suggests strong demand and internal scalability, while erratic growth can signal instability.
Impact on Your Business:
-
Aligns HR and leadership on recruitment targets
-
Highlights scalability of operations and HR infrastructure
-
Affects budget forecasts, office space, and training capacity** Aligns HR planning with company growth strategy.
17. Promotion Rate
Definition: The percentage of open positions filled through internal promotions rather than external hires.
Formula: Promotion Rate = (Number of Promotions ÷ Total Filled Roles) x 100
What It Includes:
-
Vertical promotions (e.g., associate to manager)
-
Lateral movements that involve skill growth
Why It Matters: A high promotion rate indicates robust career development and a focus on retaining talent internally. A low rate might suggest poor succession planning.
Impact on Your Business:
-
Encourages employee loyalty and engagement
-
Reduces recruitment costs and ramp-up time
-
Demonstrates a culture of growth, supporting your employer brand** Encourages employee retention and skill-building.
18. Diversity Metrics
Definition: Diversity metrics measure the demographic composition of your workforce to evaluate inclusion and equity in hiring and internal mobility.
What It Includes:
-
Gender representation
-
Racial and ethnic diversity
-
Age distribution
-
Veteran and disability status
Why It Matters: A diverse workforce drives innovation, enhances decision-making, and reflects your customer base. It also supports compliance with equal opportunity laws and strengthens your employer brand.
Impact on Your Business:
-
Attracts a wider talent pool
-
Increases employee engagement and collaboration
-
Builds credibility with socially-conscious customers and stakeholders
-
Informs DEI initiatives and reporting frameworks** Attracts top talent and meets DEI goals.
19. Quality of Hire
Definition: A metric that evaluates the value a new hire brings to the company, typically during their first year.
What It Includes:
-
Performance reviews and ratings
-
Manager satisfaction scores
-
90-day and 1-year retention rates
-
Cultural fit assessments
Formula (Sample): Quality of Hire = (Performance Score + Retention Score + Hiring Manager Satisfaction) ÷ 3
Why It Matters: High-quality hires contribute more, stay longer, and require less correction or retraining. Poor-quality hires increase costs and disrupt team performance.
Impact on Your Business:
-
Improves recruiter and hiring manager accountability
-
Enhances team productivity and culture
-
Reduces turnover and its associated costs
-
Supports better job description alignment and interview processes** Improves hiring decisions and recruiter effectiveness.
20. Revenue per Employee
Definition: A high-level metric that measures the average revenue generated by each employee.
Formula: Revenue per Employee = Total Annual Revenue ÷ Total Number of Employees
Why It Matters: It offers a snapshot of workforce productivity and helps gauge operational efficiency. A rising number may reflect strong performance or lean, efficient staffing.
Impact on Your Business:
-
Benchmarks efficiency against competitors
-
Guides hiring plans based on revenue goals
-
Shows whether labor costs are justified by business output
-
Supports executive and financial decision-making** A rising trend signals growing productivity.
21. HR Software Utilization Rate
Definition: The percentage of features and modules within your HR software that are actively being used by your team.
What It Includes:
-
Onboarding workflows
-
Performance management dashboards
-
Time-off and attendance trackers
-
Reporting and analytics features
Why It Matters: Many SMBs invest in HR software but only use a small fraction of its capabilities, reducing its ROI.
Impact on Your Business:
-
Identifies underused modules to improve workflows
-
Helps justify or renegotiate software subscriptions
-
Encourages adoption through training and internal champions
-
Ensures full compliance and reporting accuracy** Maximizing usage boosts ROI on your HR tech.
22. Administrative HR Metrics
Definition: Metrics that capture the time and effort HR teams spend on manual or routine administrative tasks.
What It Includes:
-
Time to process new hires or terminations
-
Hours spent on benefits administration or compliance filing
-
Time to resolve employee requests or payroll inquiries
Why It Matters: SMBs often have small HR teams managing many tasks. Reducing administrative burden allows those teams to focus on strategic HR functions that add long-term value.
Impact on Your Business:
-
Improves HR efficiency and morale
-
Reduces operational risk due to human error
-
Justifies investment in HR automation or outsourcing
-
Enhances internal service levels across departments** Streamlining admin tasks increases operational agility.
23. Headcount
Definition: The total number of active employees at a specific point in time, often broken down by department, role, or location.
Why It Matters: Headcount is the foundation of many other HR metrics, such as turnover rate, cost per employee, and revenue per employee. Monitoring headcount growth or decline is key to understanding your business’s scaling capacity.
Impact on Your Business:
-
Helps manage recruiting and onboarding plans
-
Informs budgeting for salaries, tools, and training
-
Identifies overstaffing or understaffing in key areas
-
Tracks company growth in alignment with strategic goals** Use headcount data for revenue-per-employee calculations and departmental planning.
24. Financial HR Metrics
Definition: A group of metrics that evaluate the financial efficiency of your HR investments and workforce operations.
What It Includes:
-
Payroll costs as a percentage of revenue
-
Benefit utilization rates
-
Training and development ROI
-
Compensation benchmarking against industry standards
Why It Matters: These metrics connect HR activity with financial outcomes and enable HR leaders to speak the same language as finance executives.
Impact on Your Business:
-
Justifies HR budgets and initiatives
-
Reveals inefficiencies in compensation, benefits, or training
-
Supports data-driven HR planning aligned with profitability
-
Highlights areas where better ROI can be achieved** Shows how HR decisions directly impact profit and cash flow.
Final Thoughts: What SMBs Should Do Next
Tracking HR metrics isn’t just for large enterprises. Small businesses that implement metric-driven HR practices gain a competitive edge in hiring, culture, and productivity. Start by choosing 5–7 important HR metrics that align with your business goals and integrate them into your HR software dashboards.
As you scale, expand your data insights across performance, cost, and engagement dimensions to build a people-first company with long-term success.
Recommended Tools: BambooHR, Gusto, Rippling, HiBob, Paycor, and Justworks offer built-in HR metrics and analytics with customizable dashboards designed for SMBs.
Want a downloadable HR Metrics Tracker or Google Sheets template? Let us know!