Gantt Charts: How to Create One and Complete Your Project
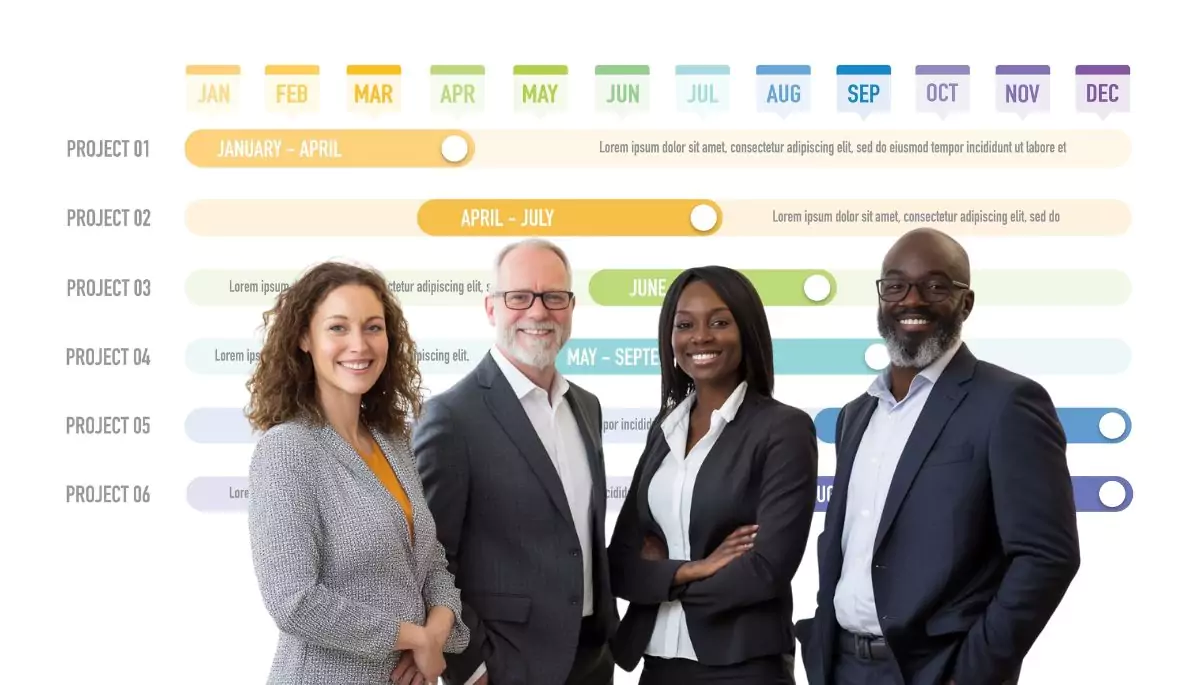
A Gantt chart is a visual way to organize your tasks into a time chart. It is a project management tool that outlines a project schedule, displaying tasks or activities along a horizontal time axis. This helps teams understand task relationships and project timelines.
Gantt charts are handy tools that are more than just colorful lines and bars on a timeline — they’re your pedantic best friends in the realm of project management.
Dreamed up over a century ago by the innovative Henry Gantt, these charts have been helping project managers keep initiatives in check and on track. Mastering Gantt charts can make your planning smoother and more effective, so let’s unpack the essentials.
Gantt Chart Meaning
A Gantt chart is a visual representation of a project schedule, helping teams see the start and finish dates of project elements at a glance. It’s a type of bar chart where each bar represents a different task or project phase laid out on a timeline. This allows project managers and team members to quickly understand the sequence of events, the duration of each task, and overlapping activities.
Typically, the horizontal axis of a Gantt chart represents the project’s time interval, while the vertical axis lists the project tasks. The two colors represent the planned timeline and the progress made on that task in the project.
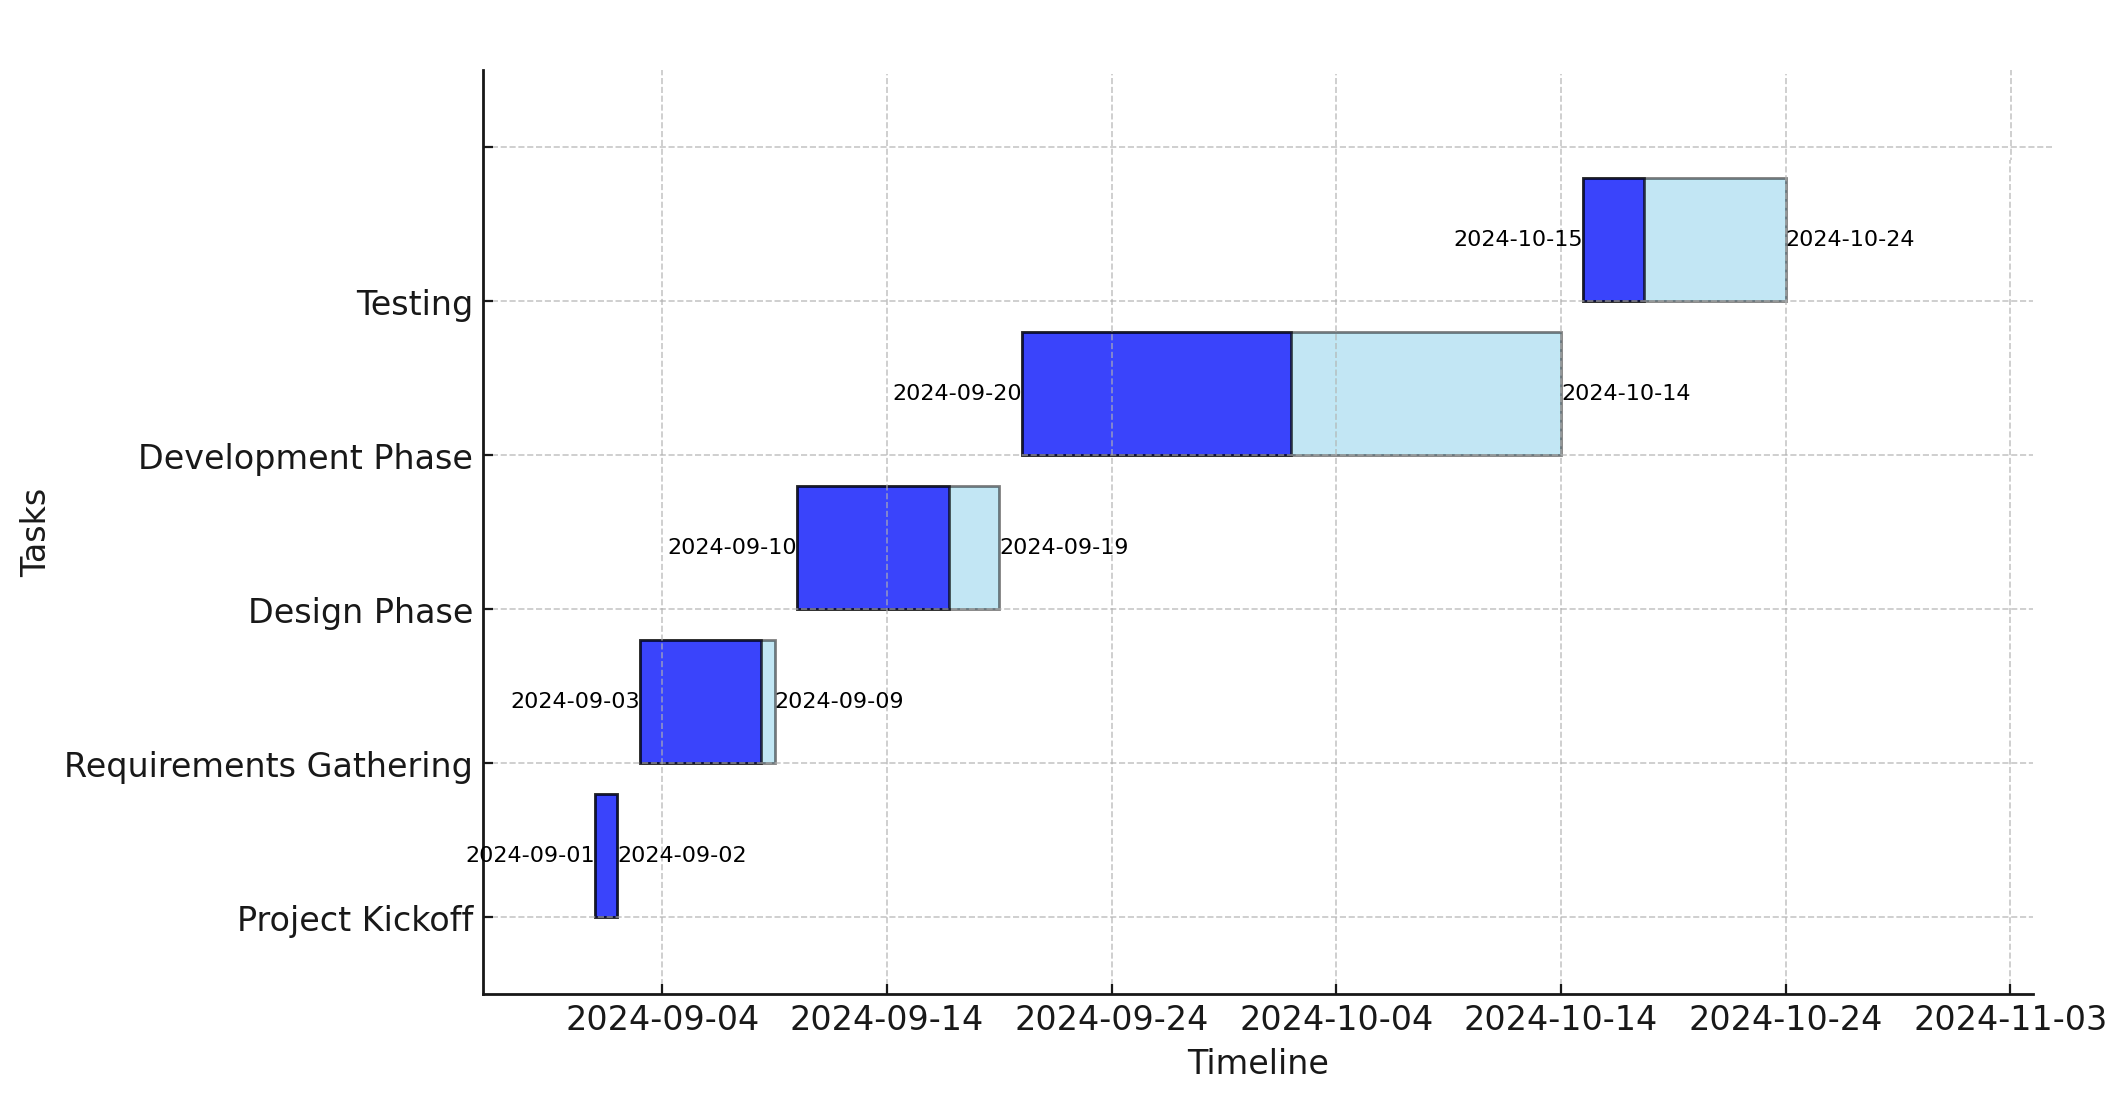
You can also add details like task dependencies, current status, who’s responsible for each task, and how much of the task is completed.
This detailed visualization helps keep everyone on the same page and can be crucial for the successful, on-time delivery of a project. Whether you’re building a skyscraper or planning a marketing campaign, a Gantt chart is a tool that can help you plot the path from start to finish.
Best Software for Gantt Chart
 Affordable plans suitable for all businesses
Free training & 24-hour support
Track progress with real-time dashboards
Custom tools fit your work at any scale
Built-in project templates
Customizable to meet your needs
Trusted by 20,000+ customers worldwide
Secure data with enterprise-grade tools
Easy-to-use & intuitive interface
Trusted by great brands
Affordable plans suitable for all businesses
Free training & 24-hour support
Track progress with real-time dashboards
Custom tools fit your work at any scale
Built-in project templates
Customizable to meet your needs
Trusted by 20,000+ customers worldwide
Secure data with enterprise-grade tools
Easy-to-use & intuitive interface
Trusted by great brands


What Is the Purpose of Gantt Charts?
Gantt charts serve a multi-faceted purpose in project management. Their primary goal is to simplify complex project information into an easy-to-understand visual format.
Here are some of the top benefits of Gantt charts:
- Clear timelines: Gantt charts provide a visual timeline for the entire project, making it easy to see the start and end dates of each task.
- Overall project overview: Stakeholders can view the entire project at a glance, which improves understanding and communication.
- Task organization: Tasks are laid out in the order they need to be completed, allowing for efficient scheduling and time management.
- Resource allocation: Gantt charts help in planning and allocating resources effectively, ensuring that no resources are over or underutilized.
- Real-time updates: As tasks are completed, the Gantt chart is updated to reflect current progress against the planned schedule.
- Visibility of delays: Any deviations from the plan are immediately visible, which helps in taking timely corrective actions.
- Team coordination: Everyone on the team can see their tasks and deadlines, fostering better coordination and collaboration.
- Stakeholder engagement: Gantt charts provide a tool for regularly updating stakeholders on progress, which can help maintain their trust and support.
- Identify bottlenecks and dependencies: Visualizing dependencies and the critical path helps identify potential bottlenecks before they cause issues.
- Predict and manage delays: By understanding task relationships and project flow, managers can predict potential delays and manage them more effectively.
- Dynamic adjustments: Gantt charts can be adjusted as the project evolves, allowing project managers to respond to changes quickly and keep the project on track.
- Enhance decision-making: Provide critical data points for decision-making by showing overlaps, gaps, and the impact of delays on the project timeline.
By laying out the entire project lifecycle in a single view, Gantt charts make it easier to ensure projects are completed on time and within scope.
What Is Included In a Gantt Chart?
A Gantt chart is a comprehensive tool that incorporates various elements to provide a detailed overview of the entire project.
Here’s what is typically included in a Gantt chart:
-
Gantt Chart Grid
The framework of the chart, where tasks are listed along the vertical axis, and the timeline spans across the horizontal axis. Each task is aligned with a horizontal bar that represents its duration. -
Gantt Chart Timeline
The timeline displays the project’s time scale, such as days, weeks, months, or even years. This timeline helps stakeholders understand the chronological sequence of tasks and their respective deadlines. -
Task Bars
Each bar on the chart represents a specific task within the project. The length of the bar indicates the duration of the task, while its position shows the start and end dates. -
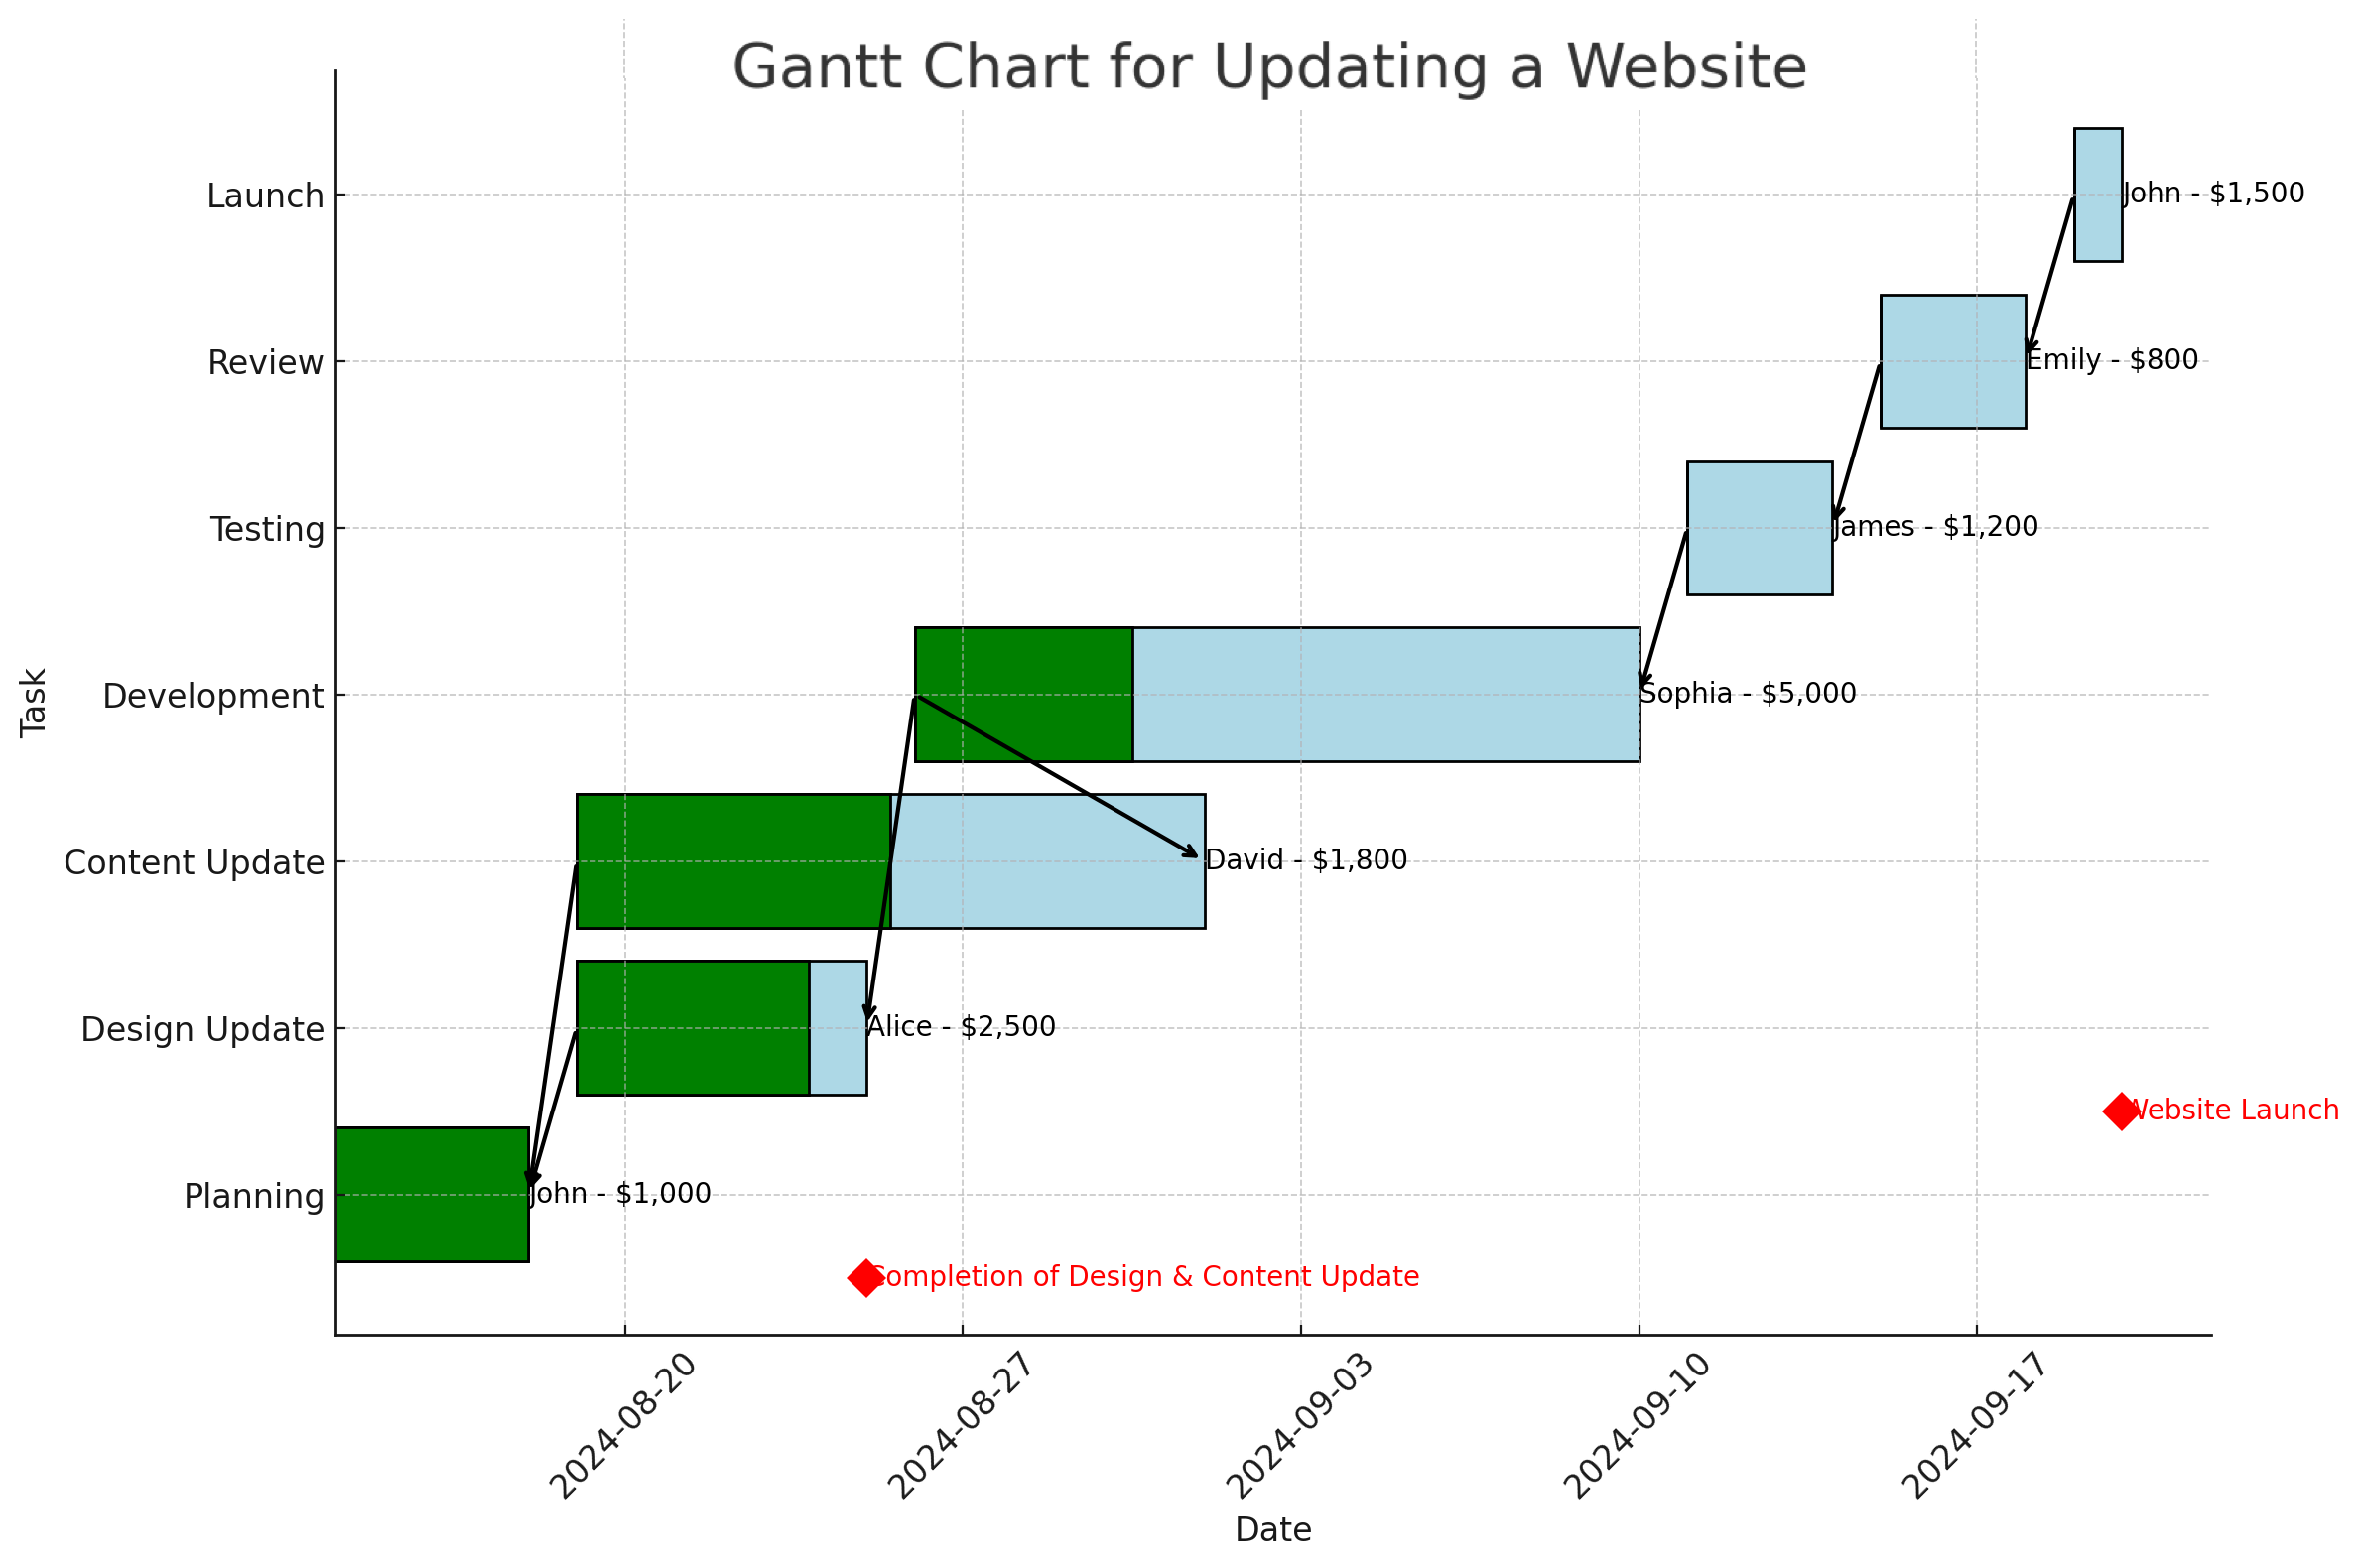
Milestones
These are special markers that denote specific events or key deliverables within the project timeline. Symbols like diamonds or triangles typically represent milestones and are not associated with duration. -
Dependency Lines
These lines connect tasks that depend on the completion of one another. Dependency lines are crucial for tracking the sequence of operations and identifying which tasks are critical to the project’s timeline. -
Progress Markers
Some Gantt charts include markers or shading within the task bars that show the progress of each task compared to its planned duration. This feature is particularly useful for tracking ongoing projects. -
Resource Information
Many Gantt charts also include information about the resources allocated to each task, such as the team members responsible or the equipment used. This helps manage resource allocation and ensure that there are no conflicts or shortages.
Each of these elements plays a vital role in making the Gantt chart a powerful tool for project planning and management, providing a clear and actionable roadmap for all project activities.
How To Make a Gantt Chart
Creating a Gantt chart is a systematic process of planning and execution using tools such as project management software or simple spreadsheets like Microsoft Excel or Google Sheets. Here’s how to approach making your own Gantt chart:
Planning to Create a Gantt Chart
The first step in creating a Gantt chart is planning in detail with your team. Gather the following information:
- List of tasks: Start by identifying all the tasks that your project will involve.
- Start and end dates: Determine when each task will begin and when it must be completed.
- Task dependencies: Establish which tasks depend on the completion of others.
- Task owners: Assign a responsible person or team for each task.
- Team members allocated: Decide which team members will work on each task.
Steps to Create a Gantt Chart
Once you have all the necessary information, you can begin drafting your Gantt chart:
Initial Setup:
- Work breakdown structure: Begin by dividing your project into smaller, manageable tasks, laying the foundation for detailed planning.
- Task list with timelines: Record all tasks along with their estimated start and end dates. Arrange these tasks on your Gantt chart to establish a clear timeline.
- Identify dependencies: Determine which tasks are dependent on others and identify the critical path to prioritize activities that directly impact the project timeline.
- Resource allocation: Assign resources to each task and schedule their involvement, ensuring that every task is adequately resourced without overloading any team member.
- Visualize with bars: Each task will be represented by a bar, the length and placement of which will reflect the task’s duration and scheduling.
Operational Use:
- Tracking and milestones: As your project progresses, use the Gantt chart to track milestones and monitor the advancement of tasks. This helps in assessing whether the project is on track according to the planned schedule.
- Resource allocation: Assign resources to each task and schedule their involvement, ensuring that every task is adequately resourced without overloading any team member.
- Adjustments and baselines: At the project’s outset, establish baselines for scope, budget, and timeline. Regularly compare actual performance against these baselines, and adjust your Gantt chart and project plan to accommodate changes.
Tips for Effective Gantt Charts
- Be flexible: Projects can change, so be ready to adjust your Gantt chart as needed to accommodate shifts in resources or timelines.
- Use milestones: Incorporate milestones to highlight key dates or achievements within the project timeline.
- Keep it clear: Your Gantt chart should be easy to read and understand, with distinct colors or labels for different tasks or phases.
- Communication: Regularly share updates from the Gantt chart with all stakeholders to ensure everyone is informed and aligned on the project status.
Creating a Gantt chart takes some planning around your project’s needs, but it’s a surefire way to boost your project management efficiency and success.
Free Gantt Chart Templates & Tools
Leverage our selection of free Gantt Chart templates designed to make project management easier and more efficient across your preferred platforms.
Google Sheets Gantt Chart Template
The Google Sheets Gantt Chart Template is a user-friendly option that requires no special tool or software, offering a simple and accessible way to manage projects. Take into consideration that it comes with more limited features compared to dedicated tools.
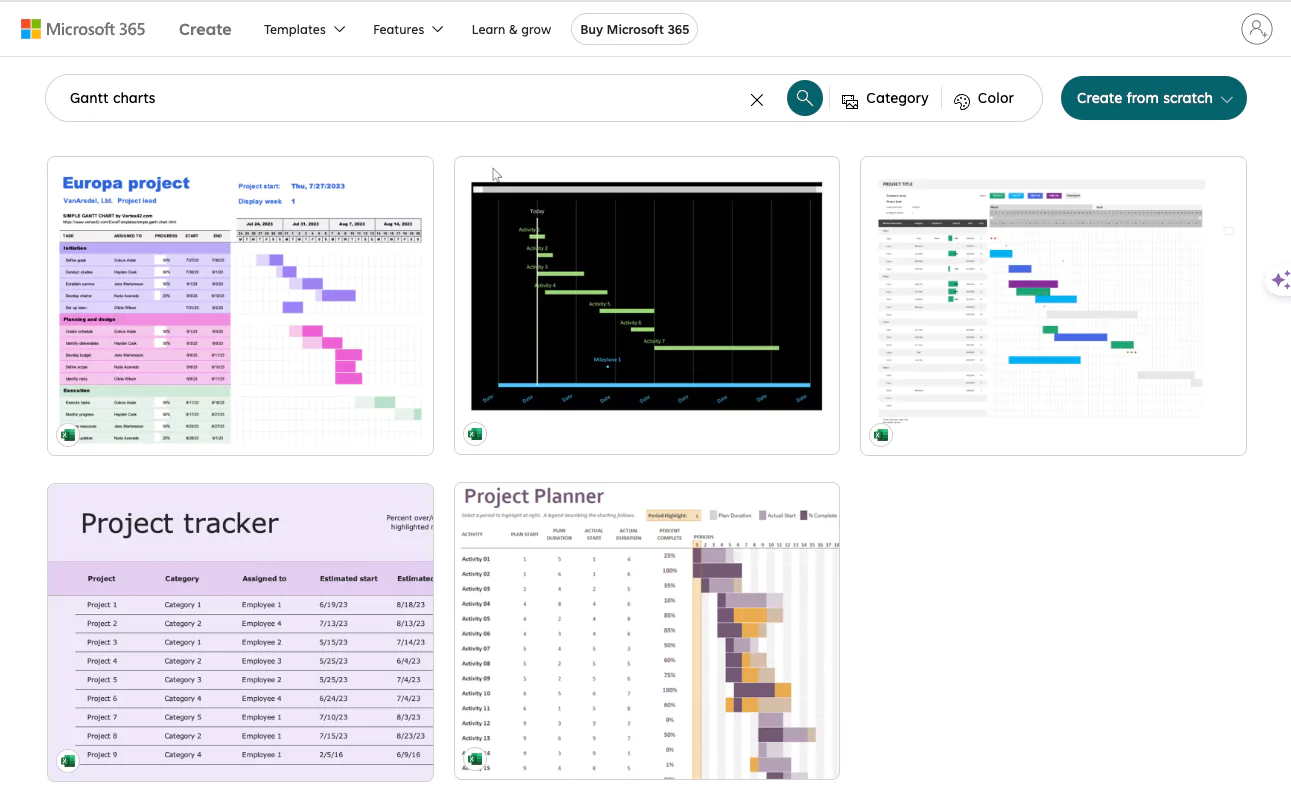
Excel Gantt Chart Template
The Excel Gantt chart template is a versatile tool for day-to-day project management, especially if you already have a Microsoft account and are familiar with Excel. It integrates seamlessly with other Microsoft Office tools and comes with a wealth of tutorials and resources to help you get started. However, the features are somewhat limited compared to dedicated project management software, making it suitable for simpler projects.
Monday.com
Monday.com is a powerful project management tool that offers a free plan, ideal for teams looking to streamline their workflows. With its intuitive interface, users can easily create Gantt charts to visualize project timelines and track progress. Monday.com’s flexible templates and automation features make it a popular choice for managing complex projects across many industries.
 Instantly organize with 200+ templates
40+ integration apps including Zoom
Instantly organize with 200+ templates
40+ integration apps including Zoom ClickUp
ClickUp is a versatile project management platform that offers a robust free plan that is perfect for teams of all sizes. It provides a comprehensive Gantt chart feature that allows users to plan, schedule, and manage projects with ease. ClickUp’s customizable views and task management options make it a go-to tool for teams aiming to stay organized and efficient.
Affordable plans suitable for all businesses
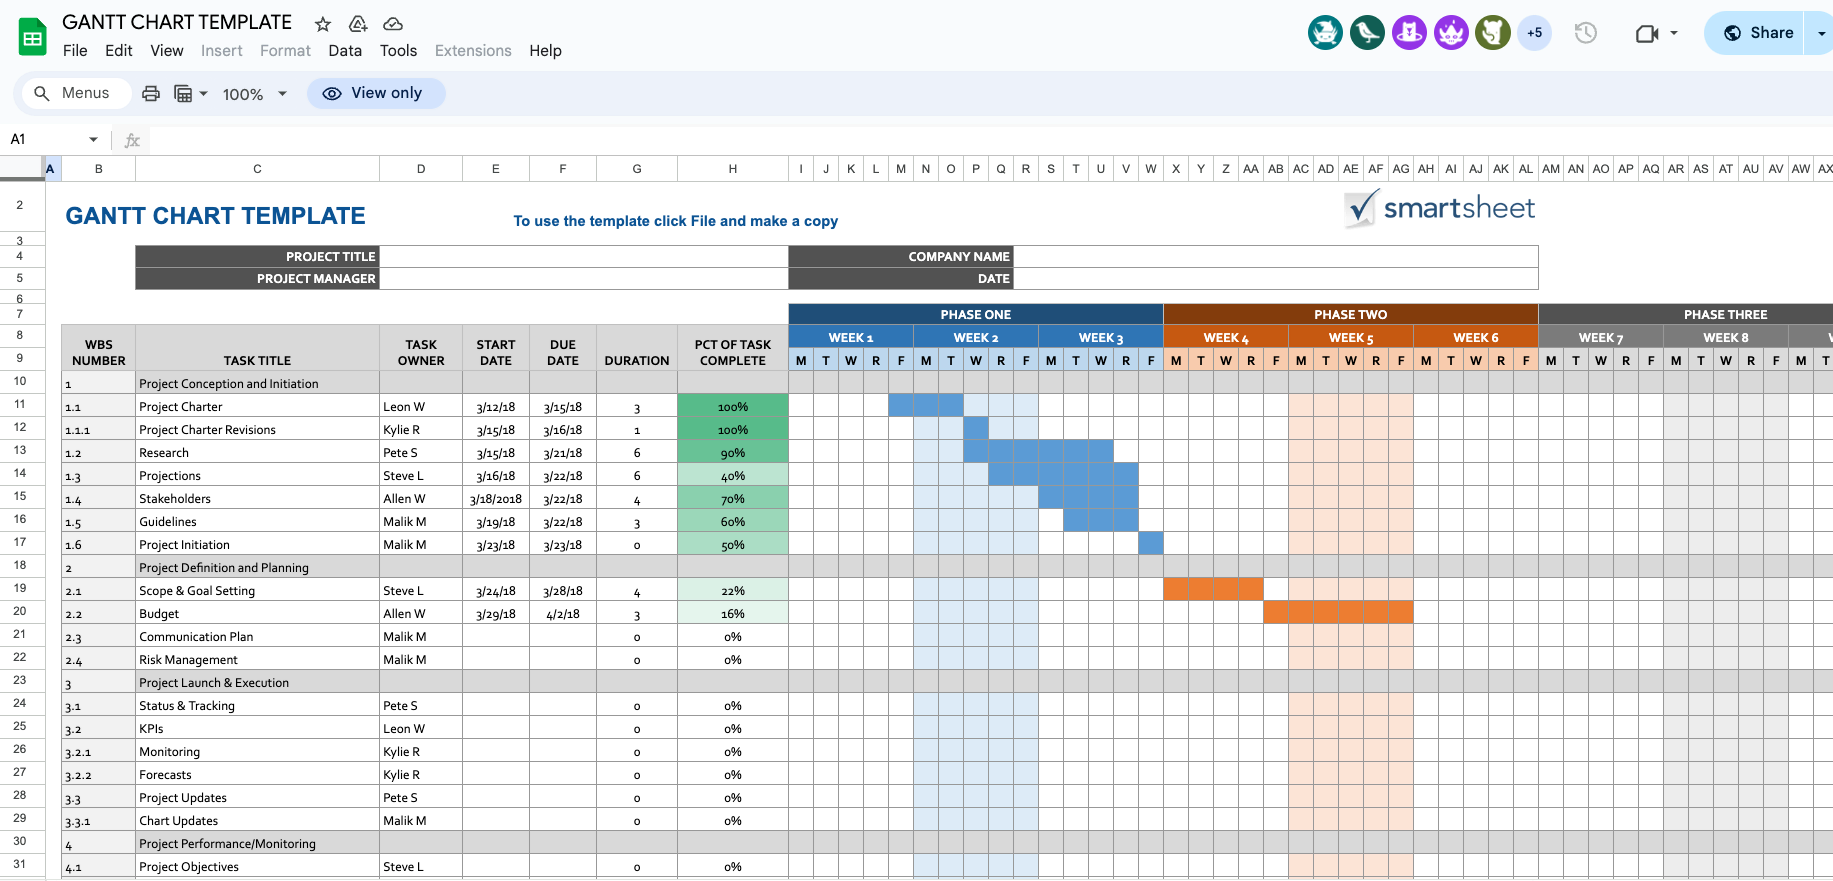
Free training & 24-hour support Smartsheet
Smartsheet is a collaborative project management tool that combines the power of spreadsheets with advanced Gantt chart capabilities. Its free tier offers essential project management features, enabling teams to create and share Gantt charts to manage project timelines effectively. Smartsheet is especially valued for its flexibility and ease of integration with other tools.
Track progress with real-time dashboards
Custom tools fit your work at any scale Wrike
Wrike is a collaborative work management platform that provides a free plan with access to essential project management tools, including Gantt charts. Wrike’s Gantt chart functionality allows teams to visualize project schedules, manage dependencies, and adjust timelines effortlessly. It’s an excellent tool for teams looking to enhance productivity and project visibility
Trusted by 20,000+ customers worldwide
Secure data with enterprise-grade tools Canva
Canva is primarily known for its graphic design capabilities, but it also offers project management tools, including Gantt charts, as part of its free plan. Users can easily create visually appealing Gantt charts to track project timelines and milestones. Canva’s user-friendly interface makes it a great option for teams that value both design and functionality in project management.
How Are Gantt Charts Used in Project Management?
Gantt charts are a fundamental tool in project management, adept at bridging the planning needs of various methodologies. Here’s how they integrate into both Waterfall and Agile project management frameworks:
Gantt Charts in Waterfall Planning
In Waterfall project management, Gantt charts are essential for mapping out the project’s phases in a sequential order. This methodology is characterized by:
- Sequential tasks: Each phase begins only after the previous one is complete.
- Visual timeline: Gantt charts show the start and end dates for each task.
- Task dependencies: Illustrates dependencies that must follow a specific sequence.
This detailed planning tool is crucial for maintaining adherence to strict timelines and ensuring the orderly execution of tasks in Waterfall projects.
Gantt Charts in Agile Planning
While Agile project management focuses on flexibility and iterative developments, Gantt charts can still be beneficial. In Agile settings, Gantt charts are adapted to:
- Sprints and iterations: Display sprints or iterations rather than detailed task dependencies.
- Schedule major events: Used to plan releases and track progress across sprints.
This approach provides Agile teams with a visual overview, helping manage time-bound elements like releases or feature rollouts while retaining the flexibility that Agile demands.
When Should You Use a Gantt Chart?
A Gantt chart becomes indispensable when your project demands more organization and detail than a simple task list can provide. Here are some clear indicators that you need a Gantt chart:
- Your project has a strict deadline: A Gantt chart helps you visualize deadlines and keep everything on track.
- Involvement of multiple teams or individuals: A Gantt chart is essential for coordinating efforts and ensuring everyone is aligned.
- A need for a visual timeline: Whether it’s for a boss, client, or team member, a Gantt chart provides a clear visual representation of the entire project timeline, making it easier to communicate progress and expectations.
- Tasks require a specific sequence: When projects involve interdependent tasks that must be completed in a particular order, a Gantt chart helps manage these dependencies effectively.
- Managing resource allocation: If team members are juggling multiple projects, a Gantt chart assists in balancing workloads and resources.
- Planning complex projects: A Gantt chart breaks down a project into manageable steps, especially for projects with many milestones or potential bottlenecks.
- Monitoring progress against milestones: A Gantt chart provides the necessary visibility to track your project’s progress and make adjustments.
- Adjusting to changes: For projects that are likely to evolve over time, a Gantt chart allows you to easily adjust schedules and plans while keeping the overall project goals in sight.
If any of these conditions apply to your project, incorporating a Gantt chart into your planning process will significantly improve your ability to manage and execute the project successfully.
What Is Gantt Chart Software?
Gantt chart software is a specialized tool designed to create, manage, and visualize Gantt charts electronically. It automates many aspects of project management, providing a dynamic platform for tracking project timelines, resources, and progress.
Key Features of Gantt Chart Software:
- Automated chart creation: Users can input task details, and the software automatically generates the Gantt chart, adjusting timelines and dependencies based on the data provided.
- Interactive timelines: These charts are not static; users can drag and adjust task bars directly, which automatically updates task durations and dependencies.
- Resource management tools: The software often includes features for assigning resources to tasks, tracking resource allocation, and ensuring that resources are used efficiently without overburdening.
- Real-Time collaboration: Many Gantt chart software options support cloud-based collaboration, allowing team members to update their progress in real time and communicate changes or issues instantly.
- Integration capabilities: Modern Gantt chart tools can integrate with other project management software, ensuring a seamless flow of information across platforms.
Gantt chart software is a valuable asset for any project manager looking to streamline project planning and execution. It enhances traditional Gantt chart benefits with modern technology, making project management more effective and efficient.
Final Thoughts
And there you have it — the ins and outs of Gantt charts!
Whether you’re a seasoned project manager or planning your next big idea, understanding how to create and utilize Gantt charts can significantly boost your project management prowess.
These savvy management tools simplify complex project timelines into manageable visuals and foster improved communication and coordination among teams.
Embracing Gantt chart software can boost project automation and real-time collaboration, resulting in a more efficient, responsive, and ultimately successful workflow.
Dive in, explore their potential, and leverage them to streamline your processes and bring your project to a successful completion.
FAQs
Q: What is a Gantt chart?
A: A Gantt chart is a visual tool used in project management to represent the timeline, duration, and dependencies of different tasks within a project.
Q: How do I create a Gantt chart?
A: You can create a Gantt chart using project management software or spreadsheets by listing tasks, their start and end dates, dependencies, and assigning resources.
Q: What are the benefits of using a Gantt chart?
A: Gantt charts help enhance visualization, improve planning and scheduling, facilitate effective progress tracking, and enhance communication among project stakeholders.
Q: Can Gantt charts be used in Agile project management?
A: Yes, while traditionally associated with Waterfall methodologies, Gantt charts can also be adapted for Agile project management by focusing on broader milestones and iterative progress.